
Results 1 to 20 of 2158
Thread: Instaforex Analysis
Threaded View
-
24-10-18, 11:19 #11
 Senior Member
Just starting here
Senior Member
Just starting here

- Join Date
- Jul 2013
- Age
- 41
- Posts
- 112
- Rep Power
- 0

Technical analysis of Gold for October 24, 2018
Gold price broke above the triangle pattern as we expected and reached $1,240. Price is now pulling back down towards the break out area. Holding above it is a bullish sign. Breaking below $1,220 would confirm the end of the upward move and the start of a new down trend.
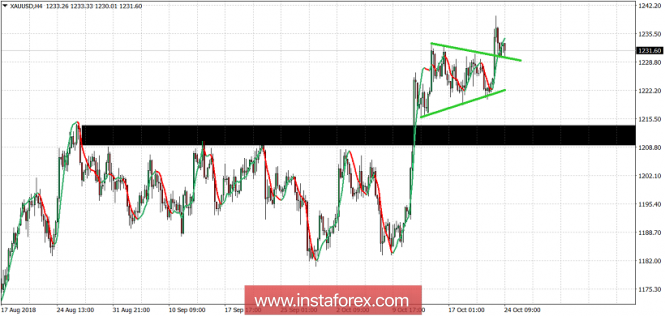
Green lines - triangle pattern (broken upwards)
Black rectangle - major support
Gold price is in a bullish short-term trend. Price broke above the triangle pattern and is now trading above the break out level. Gold price could continue its move higher towards $1,250-60 as long as it does not fall below $1,220. Bulls should raise their stops to protect gains.
*The market analysis posted here is meant to increase your awareness, but not to give instructions to make a trade.

 Reply With Quote
Similar Threads
-
Forex News from InstaForex
By InstaForex Gertrude in forum Advertisement PlaceReplies: 2103Last Post: 16-02-24, 10:27 -
Forex Technical & Market Analysis FXCC
By alayoua in forum Advertisement PlaceReplies: 4Last Post: 07-07-16, 00:25 -
Weekly technical analysis for 3 - 7.12, 2012
By bellalca in forum Affiliate program networksReplies: 0Last Post: 04-12-12, 07:09


Bookmarks