
Results 1 to 20 of 2158
Thread: Instaforex Analysis
Threaded View
-
27-03-18, 08:07 #11
 Veteran Member
Just starting here
Veteran Member
Just starting here

- Join Date
- Jun 2013
- Age
- 40
- Posts
- 4,044
- Rep Power
- 0

Daily analysis of GBP/USD for March 27, 2018
The pair stays strong in the short-term as the price action is consolidating above the support zone of 1.4136. Currently, GBP/USD is facing off the resistance level of 1.4225, which is the last hurdle ahead of the 1.4269 level and if it manages to break above such area, the bulls could strengthen in the short-term. MACD indicator remains in the positive territory, favoring to the bulls.
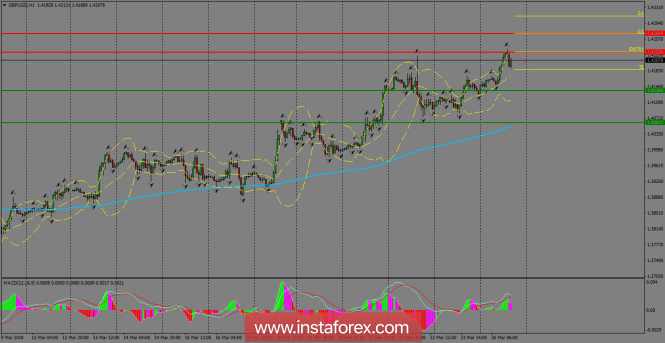
H1 chart's resistance levels: 1.4225 / 1.4269
H1 chart's support levels: 1.4136 / 1.4061
Trading recommendations for today: Based on the H1 chart, buy (long) orders only if the GBP/USD pair breaks a bullish candlestick; the resistance level is at 1.4225, take profit is at 1.4269 and stop loss is at 1.4185.
Analysis are provided byInstaForex.

 Reply With Quote
Similar Threads
-
Forex News from InstaForex
By InstaForex Gertrude in forum Advertisement PlaceReplies: 2103Last Post: 16-02-24, 10:27 -
Forex Technical & Market Analysis FXCC
By alayoua in forum Advertisement PlaceReplies: 4Last Post: 07-07-16, 00:25 -
Weekly technical analysis for 3 - 7.12, 2012
By bellalca in forum Affiliate program networksReplies: 0Last Post: 04-12-12, 07:09


Bookmarks