
Results 801 to 820 of 2158
Thread: Instaforex Analysis
-
28-06-17, 08:18 #801
 Veteran Member
Just starting here
Veteran Member
Just starting here

- Join Date
- Jun 2013
- Age
- 40
- Posts
- 4,044
- Rep Power
- 0

Technical analysis of USD/CHF for June 28, 2017
Overview:
The USD/CHF pair has kept moving downwards from the level of 0.9701. Yesterday, the pair dropped from the level of 0.9701(this level of 0.9701 coincides with the ratio of 61.8% Fibonacci retracement) to the bottom around 0.9591. Today, the first resistance level is seen at 0.9660 followed by 0.9701, while daily support 1 is seen at 0.9545. According to the previous events, the USD/CHF pair is still moving between the levels of 0.9660 and 0.9545; for that, we expect a range of 115 pips (0.9660 - 0.9545). If the USD/CHF pair fails to break through the resistance level of 0.9545, the market will decline further to 0.9500 in coming days. This would suggest a bearish market because the RSI indicator is still in a positive area and does not show any trend reversal signs. On the contrary, if a breakout takes place at the resistance level of 0.9731 (the double top), then this scenario may become invalidated.
Analysis are provided by InstaForex
-
29-06-17, 08:10 #802
Veteran Member
Just starting here
- Join Date
- Jun 2013
- Age
- 40
- Posts
- 4,044
- Rep Power
- 0
Daily analysis of USDX for June 29, 2017
Overview:
USDX is accelerating the downside and it looks can reach the support zone of 95.77 in coming hours. If the index manages to consolidate its price action below 95.77, then it's likely to test the support area of 95.10. However, we expect a recovery to take place, focusing on the resistance zone of 96.77, which coincides with the 200 SMA at H1 chart.
H1 chart's resistance levels: 96.77 / 97.20
H1 chart's support levels: 96.38 / 95.77
Trading recommendations for today: Based on the H1 chart, place sell (short) orders only if the USD Index breaks with a bearish candlestick; the support level is at 95.77, take profit is at 95.10 and stop loss is at 96.42.
Analysis are provided by InstaForex
-
30-06-17, 08:31 #803
Veteran Member
Just starting here
- Join Date
- Jun 2013
- Age
- 40
- Posts
- 4,044
- Rep Power
- 0
Elliott wave analysis of EUR/NZD for June 30, 2017
Wave summary;
Red wave ii is likely turning into an expanded flat correction, which calls for a final decline to just below 1.5480 before turning strongly higher in red wave iii. After an expanded flat wave two correction, the following wave three rallies should be expected to extend and that will call for a rally to at least 1.6232 and possibly even higher.
R3: 1.5931
R2: 1.5801
R1: 1.5712
Pivot: 1.5650
S1: 1.5600
S2: 1.5500
S3: 1.5450
Trading recommendation:
We are long EUR from 1.5645 with stop placed at 1.5210. If you are not long EUR yet, then buy EUR near 1.5450 and use the same stop.
Analysis are provided by InstaForex
-
03-07-17, 07:47 #804
Veteran Member
Just starting here
- Join Date
- Jun 2013
- Age
- 40
- Posts
- 4,044
- Rep Power
- 0
Technical analysis of USD/JPY for July 03, 2017
In Asia, Japan will release the Consumer Confidence, Final Manufacturing PMI, Tankan Non-Manufacturing Index, and Tankan Manufacturing Index data, and the US will release some Economic Data, such as Total Vehicle Sales, ISM Manufacturing Prices, Construction Spending m/m, ISM Manufacturing PMI, and Final Manufacturing PMI. So, there is a probability the USD/JPY will move with low to medium volatility during this day.
TODAY'S TECHNICAL LEVEL:
Resistance. 3: 112.87.
Resistance. 2: 112.65.
Resistance. 1: 112.43.
Support. 1: 112.16.
Support. 2: 111.94.
Support. 3: 111.72.
Analysis are provided by InstaForex
-
18-07-17, 08:07 #805
Veteran Member
Just starting here
- Join Date
- Jun 2013
- Age
- 40
- Posts
- 4,044
- Rep Power
- 0
Technical analysis of EUR/USD for July 18, 2017
When the European market opens, some Economic Data will be released, such as ZEW Economic Sentiment and German ZEW Economic Sentiment. The US will release the Economic Data, too, such as NAHB Housing Market Index and Import Prices m/m, so, amid the reports, EUR/USD will move in a low to medium volatility during this day.
TODAY'S TECHNICAL LEVEL:
Breakout BUY Level: 1.1528.
Strong Resistance:1.1521.
Original Resistance: 1.1510.
Inner Sell Area: 1.1499.
Target Inner Area: 1.1472.
Inner Buy Area: 1.1445.
Original Support: 1.1434.
Strong Support: 1.1423.
Breakout SELL Level: 1.1416.
Analysis are provided by InstaForex
-
19-07-17, 08:19 #806
Veteran Member
Just starting here
- Join Date
- Jun 2013
- Age
- 40
- Posts
- 4,044
- Rep Power
- 0
Technical analysis of NZD/USD for July 19, 2017
Overview:
The NZD/USD pair is showing signs of strength following a breakout of the highest level of 0.7307. On the H1 chart. the level of 0.7307 coincides with 61.8% of Fibonacci, which is expected to act as minor support today. Since the trend is above the 61.8% Fibonacci level, the market is still in an uptrend. So, major support is seen at the level of 0.7307. Furthermore, the trend is still showing strength above the moving average (100). Thus, the market is indicating a bullish opportunity above the above-mentioned support levels, for that the bullish outlook remains the same as long as the 100 EMA is headed to the upside. Therefore, strong support will be found at the level of 0.7307 providing a clear signal to buy with a target seen at 0.7372. If the trend breaks the minor resistance at 0.7372, the pair will move upwards continuing the bullish trend development to the level 0.7400 in order to test the daily resistance 1. However, it would also be sage to consider where to place a stop loss; this should be set below the second support of 0.7287.
Analysis are provided by InstaForex
-
20-07-17, 08:32 #807
Veteran Member
Just starting here
- Join Date
- Jun 2013
- Age
- 40
- Posts
- 4,044
- Rep Power
- 0
Technical analysis of USD/JPY for July 20, 2017
In Asia, Japan will release the BOJ Press Conference, All Industries Activity m/m, BOJ Policy Rate, BOJ Outlook Report, Monetary Policy Statement, and Trade Balance data, and the US will release some Economic Data, such as Natural Gas Storage, CB Leading Index m/m, Philly Fed Manufacturing Index, and Unemployment Claims. So, there is a probability the USD/JPY will move with low to medium volatility during this day.
TODAY'S TECHNICAL LEVEL:
Resistance. 3: 112.43.
Resistance. 2: 112.21.
Resistance. 1: 112.01.
Support. 1: 111.73.
Support. 2: 111.51.
Support. 3: 111.29.
Analysis are provided by InstaForex
-
21-07-17, 08:16 #808
Veteran Member
Just starting here
- Join Date
- Jun 2013
- Age
- 40
- Posts
- 4,044
- Rep Power
- 0
Technical analysis of USD/CHF for July 21, 2017
Overview:
The USD/CHF pair.
Pivot: 0.9590.
The swissy fell from the level of 0.9665 to bottom at 0.9523. The USD/CHF pair has faced strong support at the level of 0.9523 (the double bottom). Current price is around the spot of 0.9520. So, the strong support has been already faced at the level of 0.9523 and the pair is likely to try to approach it in order to test it again and form a double bottom. Hence, the USD/CHF pair is continuing to trade in a bullish trend from the new support level of 0.9523; to form a bullish channel. According to the previous events, we expect the pair to move between 0.9523 and 0.9665. Also, it should be noted major resistance is seen at 0.9665, while immediate resistance is found at 0.9590. Then, we may anticipate potential testing of 0.9665 to take place soon. Moreover, if the pair succeeds in passing through the level of 0.9665, the market will indicate a bullish opportunity above the level of 0.9665. A breakout of that target will move the pair further upwards to 0.9746. Buy orders are recommended above the area of 0.9523 with the first target at the level of 1.9590 and continue towards the levels of 0.9665 and 0.9746. However, if the USD/CHF pair fails to break out through the resistance level of 1.9590; the market will decline further to the level of 0.9453.
Analysis are provided by InstaForex
-
24-07-17, 09:47 #809
Senior Member
Just starting here
- Join Date
- Jul 2013
- Age
- 41
- Posts
- 112
- Rep Power
- 0
NZD/USD Intraday technical levels and trading recommendations for July 24, 2017
Daily Outlook
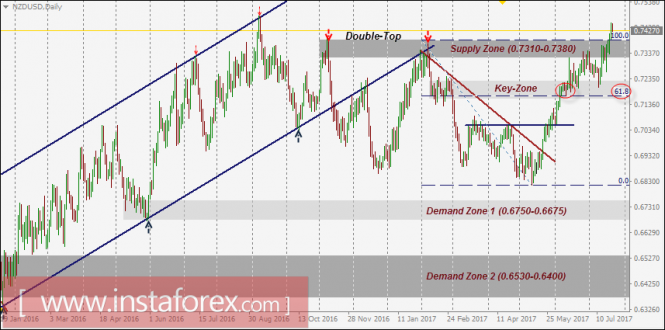
The NZD/USD pair has been trending up within the depicted bullish channel since January 2016.
In November 2016, early signs of bullish weakness were expressed on the chart when the pair failed to record a new high above 0.7400.
A bearish breakout of the lower limit of the channel took place in December 2016. In February 2017, the depicted short-term downtrend was initiated in the depicted supply zone (0.7310-0.7380).
However, a recent bullish breakout above the downtrend line took place in May 22. Since then, the market has been bullish as depicted on the chart.
The price zone of 0.7150-0.7230 (SUPPLY ZONE in confluence with 61.8% Fibonacci level) stood as a temporary resistance zone until a bullish breakout was expressed above 0.7230.
This resulted in a quick bullish advance towards the next supply zone around 0.7310-0.7380 which is being temporarily breached to the upside.
Now the price zone of 0.7310-0.7380 turns to be a newly-established demand-zone to be watched for possible bullish rejection if any bearish pullback occurs.
InstaForex analytical reviews will make you fully aware of market trends!
Being an InstaForex client, you are provided with a large number of free services for efficient trading.
-
25-07-17, 09:45 #810
Senior Member
Just starting here
- Join Date
- Jul 2013
- Age
- 41
- Posts
- 112
- Rep Power
- 0
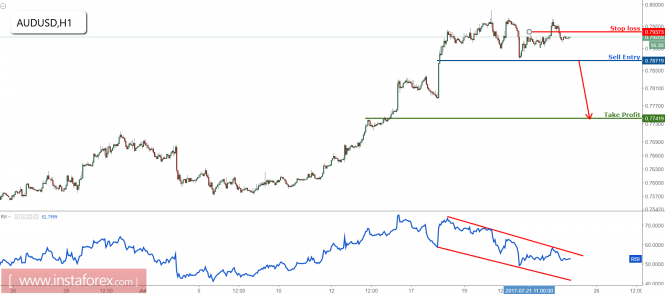
AUD/USD prepare to sell on break of key support
The price is hovering above key support at 0.7871 (Fibonacci retracement, horizontal swing low support) and we prepare to sell once price breaks this key level. Our profit target is a push down to next key support level at 0.7741 (Fibonacci retracement, horizontal pullback support).
RSI (55) is seeing bearish momentum within its bearish descending channel.
Sell below 0.7871. Stop loss is at 0.7937. Take profit is at 0.7741.
InstaForex analytical reviews will make you fully aware of market trends!
Being an InstaForex client, you are provided with a large number of free services for efficient trading.
-
26-07-17, 10:01 #811
Senior Member
Just starting here
- Join Date
- Jul 2013
- Age
- 41
- Posts
- 112
- Rep Power
- 0
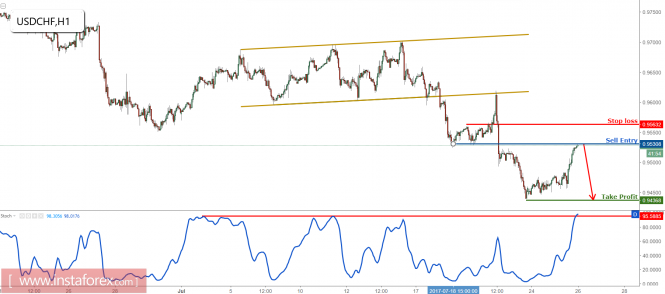
USD/CHF profit target reached perfectly, prepare to sell
The price has shot up perfectly and reached our profit target from yesterday. We prepare to sell below major resistance at 0.9530 (Fibonacci retracement, Fibonacci extension, horizontal pullback resistance) for a push down to at least 0.9436 support (Fibonacci extension, horizontal swing low support).
Stochastic (55,5,3) is right on major resistance at 95%.
Sell below 0.9530. Stop loss is at 0.9563. Take profit is at 0.9436.
InstaForex analytical reviews will make you fully aware of market trends!
Being an InstaForex client, you are provided with a large number of free services for efficient trading.
-
27-07-17, 08:30 #812
Veteran Member
Just starting here
- Join Date
- Jun 2013
- Age
- 40
- Posts
- 4,044
- Rep Power
- 0
Technical analysis of EUR/USD for July 27, 2017
When the European market opens, some Economic Data will be released, such as Private Loans y/y, M3 Money Supply y/y, GfK German Consumer Climate, and Spanish Unemployment Rate. The US will release the Economic Data, too, such as Natural Gas Storage, Prelim Wholesale Inventories m/m, Goods Trade Balance, Durable Goods Orders m/m, Unemployment Claims, and Core Durable Goods Orders m/m, so, amid the reports, EUR/USD will move in a low to medium volatility during this day.
TODAY'S TECHNICAL LEVEL:
Breakout BUY Level: 1.1787.
Strong Resistance:1.1780.
Original Resistance: 1.1769.
Inner Sell Area: 1.1758.
Target Inner Area: 1.1730.
Inner Buy Area: 1.1702.
Original Support: 1.1691.
Strong Support: 1.1680. Breakout SELL Level: 1.1673.
Analysis are provided by InstaForex
-
28-07-17, 07:37 #813
Veteran Member
Just starting here
- Join Date
- Jun 2013
- Age
- 40
- Posts
- 4,044
- Rep Power
- 0
Technical analysis of USD/CHF for July 28, 2017
Overview:
The USD/CHF pair broke resistance which turned to a strong support at the level of 0.9579 yesterday. The level of 0.9579 coincides with 38.2% of Fibonacci, which is expected to act as a major support today. Since the trend is above the 38.2% Fibonacci level, the market is still in an uptrend. From this point, the USD/CHF pair is continuing in a bullish trend from the new support of 0.9575. Currently, the price is in a bullish channel. According to the previous events, we expect the USD/CHF pair to move between 0.9579 and 0.9728. In the H4 chart, resistance is seen at the levels of 0.9666 and 0.9728. Also, it should be noticed that the level of 0.9666 represents the daily pivot point. Therefore, a strong support will be formed at the level of 0.9575 providing a clear signal to buy with the targets seen at 0.9666. If the trend breaks the support at 0.9666 (the first resistance), the pair will move upwards continuing the development of the bullish trend to the level 0.9728 in order to test the daily resistance 2. However, the stop loss is to be placed below the level of 0.952.
Analysis are provided by InstaForex
-
31-07-17, 08:17 #814
Veteran Member
Just starting here
- Join Date
- Jun 2013
- Age
- 40
- Posts
- 4,044
- Rep Power
- 0
Technical analysis of EUR/USD for July 31, 2017
When the European market opens, some economic data will be released such as unemployment rate, Italian flash CPI m/m, core CPI flash estimate y/y, CPI flash estimate y/y, Italian monthly unemployment rate, and German retail sales m/m. The US will release its pending home sales m/m and Chicago PMI. So amid the reports, the EUR/USD will move in a low to medium volatility today.
Today's technical levels:
Breakout buy Level: 1.1804.
Strong resistance:1.1797.
Original resistance: 1.1786.
Inner sell area: 1.1775.
Target inner area: 1.1747.
Inner buy area: 1.1719.
Original support: 1.1708.
Strong support: 1.1697.
Breakout sell level: 1.1690.
Analysis are provided by InstaForex
-
01-08-17, 08:45 #815
Veteran Member
Just starting here
- Join Date
- Jun 2013
- Age
- 40
- Posts
- 4,044
- Rep Power
- 0
EUR/JPY profit target reached once again, prepare to sell
The price has bounced above our buying entry and is fast approaching our profit target once again. We prepare to sell below major resistance at 130.78 (Fibonacci extension, horizontal swing high resistance) for a drop towards 129.96 support (Fibonacci retracement, horizontal pullback support).
Stochastic (34,5,3) is seeing major resistance below 94% where we expect a strong drop from.
Correlation analysis: We are seeing JPY strength with AUD/JPY and EUR/JPY expecting drops. We are also expecting EUR weakness with strong resistance seen on EUR/USD and EUR/JPY.
Sell below 130.78. Stop loss is at 131.08. Take profit is at 129.96.
Analysis are provided by InstaForex
-
02-08-17, 08:17 #816
Veteran Member
Just starting here
- Join Date
- Jun 2013
- Age
- 40
- Posts
- 4,044
- Rep Power
- 0
Technical analysis of USD/JPY for Aug 02, 2017
In Asia, Japan will release the Consumer Confidence and Monetary Base y/y data, and the US will release some Economic Data, such as Crude Oil Inventories and ADP Non-Farm Employment Change. So, there is a probability the USD/JPY will move with medium volatility during this day.
TODAY'S TECHNICAL LEVEL:
Resistance. 3: 111.05.
Resistance. 2: 110.84.
Resistance. 1: 110.62.
Support. 1: 110.34.
Support. 2: 110.13.
Support. 3: 109.91.
Analysis are provided by InstaForex
-
04-08-17, 08:58 #817
Veteran Member
Just starting here
- Join Date
- Jun 2013
- Age
- 40
- Posts
- 4,044
- Rep Power
- 0
Technical analysis of USD/JPY for Aug 04, 2017
In Asia, Japan will release the Average Cash Earnings y/y data, and the US will release some Economic Data, such as Trade Balance, Unemployment Rate, Non-Farm Employment Change, and Average Hourly Earnings m/m. So, there is a probability the USD/JPY will move with medium to high volatility during this day.
TODAY'S TECHNICAL LEVEL:
Resistance. 3: 110.63.
Resistance. 2: 110.41.
Resistance. 1: 110.20.
Support. 1: 109.93.
Support. 2: 109.72.
Support. 3: 109.50.
Analysis are provided by InstaForex
-
08-08-17, 07:58 #818
Veteran Member
Just starting here
- Join Date
- Jun 2013
- Age
- 40
- Posts
- 4,044
- Rep Power
- 0
Technical analysis of EUR/USD for Aug 08, 2017
When the European market opens, some Economic Data will be released, such as French Trade Balance, French Gov Budget Balance, and German Trade Balance. The US will release the Economic Data, too, such as IBD/TIPP Economic Optimism, Mortgage Delinquencies, JOLTS Job Openings, and NFIB Small Business Index, so, amid the reports, EUR/USD will move in a low to medium volatility during this day.
TODAY'S TECHNICAL LEVEL:
Breakout BUY Level: 1.1855.
Strong Resistance:1.1848.
Original Resistance: 1.1837.
Inner Sell Area: 1.1826.
Target Inner Area: 1.1798.
Inner Buy Area: 1.1770.
Original Support: 1.1759.
Strong Support: 1.1748.
Breakout SELL Level: 1.1741.
Analysis are provided by InstaForex
-
09-08-17, 07:46 #819
Veteran Member
Just starting here
- Join Date
- Jun 2013
- Age
- 40
- Posts
- 4,044
- Rep Power
- 0
Germany shows its poor performance
Data for France and Germany, which came out in the morning, were completely ignored by the market. The low intraday volatility, which did not exceed 20 points in the EURUSD pair, indicates that many investors and traders prefer to take some pause, since the US dollar's rally since Friday is no longer supported by large players, and many market participants are in a bit of a confusion and are unsure how to proceed.
According to the statistics agency, there is a decline in German imports and exports. However, this has not yet affected the foreign trade balance.
As indicated in the report, Germany's exports in June this year compared with May decreased by 2.8%, while the reduction in imports was 4.5%. Germany's foreign trade surplus in June amounted to 21.2 billion euros, while economists predicted the trade balance at the level of 21.4 billion euros. It should be noted that as early as May of this year, the surplus passed the 20 billion euros mark for the first time.
The reduction in industrial production in Germany, which was reported yesterday, along with today's data, is the first alarm bell that the economic growth rate of the first-largest euro-zone economy is gradually slowing down, which will undoubtedly affect the indicators for the second quarter of this year.
According to the statistics agency, the current deficit in France's balance of payments increased. This happened due to the sharper than expected decline in exports.
According to the report, in June this year the negative balance of the current account the balance of payments totaled to 2.1 billion euros against 1.9 billion euros in May. The trade deficit rose to 4.7 billion euros. The deficit of the state budget of France in June rose to 62.3 billion euros from 61.8 billion euros in May. Since the inauguration of the new president of France, very little time has passed, but, as we recall, Macron promised to give a lot of effort to combat the budget deficit.
In the afternoon, data came from The Retail Economist and Goldman Sachs, according to which retail sales increased during the reporting week. So, the index of sales in US retail chains increased by 2.4% for the week from July 30 to August 5, while in comparison with the same period last year the index grew by 1.1%.
As for the technical picture of the EURUSD pair, it remained unchanged compared to the morning review.
A further downward trend will be entirely fixed at yesterday's support level of 1.1790, to gain a foothold below which it has not yet been possible. Selling is recommended after the return of the trading instrument under the level of 1.1790, with the main goal of reducing the support area to 1.1740. A breakthrough in this area will open up the possibility of the euro falling to new weekly lows of around 1.1670.
Analysis are provided by InstaForex
-
10-08-17, 07:54 #820
Veteran Member
Just starting here
- Join Date
- Jun 2013
- Age
- 40
- Posts
- 4,044
- Rep Power
- 0
Elliott wave analysis of EUR/NZD for August 10, 2017
Wave summary:
EUR/NZD continues to work its way higher towards the expected target at 1.6236. This resistance should only be able to provide temporary resistance, before the next swing higher towards 1.6969.
Short-term support is now seen at 1.6005 and again at 1.5920.
R3: 1.6236
R2: 1.6196
R1: 1.6081
Pivot: 1.6050
S1: 1.6005
S2: 1.5959
S3: 1.5920
Trading recommendation:
We are long EUR from 1.5510 with stop placed at 1.5825. If you are not long EUR yet, then buy near 1.6005 and use the same stop at 1.5825.
Analysis are provided by InstaForex

 Reply With Quote
Similar Threads
-
Forex News from InstaForex
By InstaForex Gertrude in forum Advertisement PlaceReplies: 2103Last Post: 16-02-24, 10:27 -
Forex Technical & Market Analysis FXCC
By alayoua in forum Advertisement PlaceReplies: 4Last Post: 07-07-16, 00:25 -
Weekly technical analysis for 3 - 7.12, 2012
By bellalca in forum Affiliate program networksReplies: 0Last Post: 04-12-12, 07:09


Bookmarks