Thread: Instaforex Analysis
Hybrid View
-
22-05-17, 10:00 #1
Senior Member Just starting here
- Join Date
- Jul 2013
- Age
- 40
- Posts
- 112
- Rep Power
- 0
Ichimoku indicator analysis of gold for May 22, 2017
Gold price is overbought in the short-term and justifies a pullback towards $1,240. It is important for Gold bulls to hold above $1,230 and create a new short-term base of a higher low in order to move above $1,280-$1,300 which is the long-term resistance.
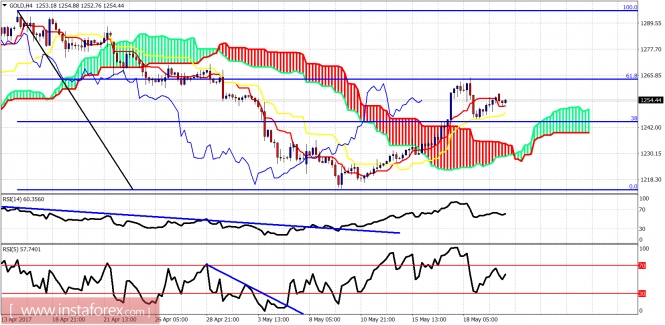
Gold price is trading above the Ichimoku cloud support. Price got rejected at the resistance of the 61.8% Fibonacci retracement. Short-term support is at $1,247 and next at $1,230. Price is expected to move lower before higher.
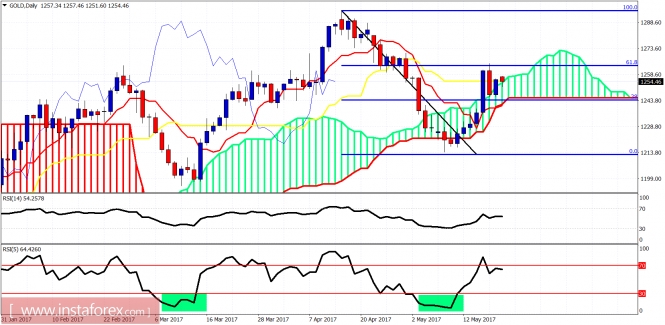
Gold daily chart shows price above daily cloud but below the 61.8% Fibo level resistance. I expect a pullback and a higher low to be created over this week. As long as price is above $1,213 we target $1,230-40 and next $1,280-$1,300. If the $1,213 low is broken, expect a move towards $1,150-60.
InstaForex analytical reviews will make you fully aware of market trends!
Being an InstaForex client, you are provided with a large number of free services for efficient trading.
More analysis - at instaforex.com
-
25-05-17, 10:01 #2
Senior Member Just starting here
- Join Date
- Jul 2013
- Age
- 40
- Posts
- 112
- Rep Power
- 0
Technical analysis of USD/CHF for May 25, 2017
Overview:
The USD/CHF pair. The first resistance level is seen at 0.9787 followed by 0.9847, while daily support 1 is seen at 0.9691. The USD/CHF pair broke support which turned to strong resistance at 0.9787. The market is still set to trade around the daily pivot point of 0.9739. This week, it continued to move downwards from the level of 0.9787 to the bottom around 0.9739. The pair is trading below this level. It is likely to trade in a lower range as long as it remains below the resistance of 0.9787 which is expected to act as major resistance. Amid the previous events, the USD/CHF pair is still moving between the levels of 0.9787 and 0.9691. For that reason, the major resistance can be found at 0.9787 providing a clear signal to sell with a target seen at 0.9691. If the trend breaks the minor support at 0.9691, the pair will move downwards continuing the bearish trend development to the level of 0.9645 and 0.9600 in order to test the daily support 3. Overall, we still prefer the bearish scenario which suggests that the pair will stay below the area of 0.9787 (resistance).
InstaForex analytical reviews will make you fully aware of market trends!
Being an InstaForex client, you are provided with a large number of free services for efficient trading.
More analysis - at instaforex.com
-
26-05-17, 10:32 #3
Senior Member Just starting here
- Join Date
- Jul 2013
- Age
- 40
- Posts
- 112
- Rep Power
- 0
Elliott wave analysis of EUR/JPY for May 26, 2017
Wave summary:
We continue to look for a corrective decline into the 123.78 - 124.17 area before the next impulsive rally towards 134.30 and 138.52 should be expected. Short-term resistance is now seen at 125.16 and again at 125.43, Only a break above the later will indicate that the correction is complete and more upside towards 134.30 is developing.
R3: 125.81
R2: 125.43
R1: 125.16
Pivot: 125.00
S1: 124.86
S2: 124.17
S3: 123.78
Trading recommendation:
We will re-buy EUR at 124.20 or upon a break above 125.43.
InstaForex analytical reviews will make you fully aware of market trends!
Being an InstaForex client, you are provided with a large number of free services for efficient trading.
More analysis - at instaforex.com
-
26-05-17, 10:33 #4
Senior Member Just starting here
- Join Date
- Jul 2013
- Age
- 40
- Posts
- 112
- Rep Power
- 0
Elliott wave analysis of EUR/JPY for May 26, 2017
Wave summary:
We continue to look for a corrective decline into the 123.78 - 124.17 area before the next impulsive rally towards 134.30 and 138.52 should be expected. Short-term resistance is now seen at 125.16 and again at 125.43, Only a break above the later will indicate that the correction is complete and more upside towards 134.30 is developing.
R3: 125.81
R2: 125.43
R1: 125.16
Pivot: 125.00
S1: 124.86
S2: 124.17
S3: 123.78
Trading recommendation:
We will re-buy EUR at 124.20 or upon a break above 125.43.
InstaForex analytical reviews will make you fully aware of market trends!
Being an InstaForex client, you are provided with a large number of free services for efficient trading.
More analysis - at instaforex.com
Similar Threads
-
Forex News from InstaForex
By InstaForex Gertrude in forum Advertisement PlaceReplies: 2103Last Post: 16-02-24, 09:27 -
Forex Technical & Market Analysis FXCC
By alayoua in forum Advertisement PlaceReplies: 4Last Post: 06-07-16, 23:25 -
Weekly technical analysis for 3 - 7.12, 2012
By bellalca in forum Affiliate program networksReplies: 0Last Post: 04-12-12, 06:09
Bookmarks