
Results 1,561 to 1,580 of 2158
Thread: Instaforex Analysis
Hybrid View
-
20-09-21, 09:40 #1
 Veteran Member
Just starting here
Veteran Member
Just starting here

- Join Date
- Jun 2013
- Age
- 40
- Posts
- 4,044
- Rep Power
- 0

Forex Analysis & Reviews: Elliott wave analysis of Ripple for September 20, 2021
Ripple should move closer to the 61.8% corrective target near 0.8560 before completing the corrective decline in wave ii. If so, we will be looking for the next strong impulsive rally in wave iii towards 2.3227 and maybe even higher. In the short term, we see resistance near 1.0526, which is expected to cap the upside for the corrective decline to 0.8560 and the higher in the next impulsive rally towards 2.3227.
Analysis are provided by InstaForex
-
21-09-21, 10:00 #2
Veteran Member
Just starting here
- Join Date
- Jun 2013
- Age
- 40
- Posts
- 4,044
- Rep Power
- 0
Forex Analysis & Reviews: Trading plan for EURUSD for September 21, 2021
Technical outlook:
EURUSD might have carved an interim bottom around 1.1700 mark on Monday. The currency pair has bounced off through 1.1740 mark and has also produced a pinbar candlestick on the daily chart. High probability remains for bulls to take control back from here and push towards 1.1850, 1.1950 and 1.2050 potential targets.
EURUSD is probably into its last leg of the counter trend rally, which had begun since 1.1660 lows. The down gartley should likely terminate around 1.2050 mark, which is also the Fibonacci 0.618 retracement of the recent downswing (1.2266 to 1.1660). Bears might come back in control thereafter.
EURUSD is seen to be trading around 1.1735 level at this point in writing and is expected to push higher against 1.1660 mark. Immediate support is seen at 1.1660, while resistance comes in around 1.1850, followed by 1.1900 levels respectively. Only a drop below 1.1660 would change the above bullish scenario.
Trading plan:
Potential towards 1.2050 against 1.1660
Good luck!
Analysis are provided by InstaForex
-
22-09-21, 09:43 #3
Veteran Member
Just starting here
- Join Date
- Jun 2013
- Age
- 40
- Posts
- 4,044
- Rep Power
- 0
Forex Analysis & Reviews: Elliott wave analysis of EUR/JPY for September 22, 2021
EUR/JPY made it almost back to the start of wave i at 127.92. We have seen the low of wave ii at 127.95. Wave ii is allowed to correct to 99.99% of wave ii, but not more and therefore should stay above 127.92 or else, we will need to make a revision of our preferred count.
As long as short-term key-support at 127.92 is able to act as a floor, we will be looking for a break above minor resistance at 128.70 and more importantly a break above resistance at 129.55 as confirmation that wave ii has been completed and wave iii is unfolding towards 134.24 and135.42 .
Analysis are provided by InstaForex
-
23-09-21, 08:50 #4
Veteran Member
Just starting here
- Join Date
- Jun 2013
- Age
- 40
- Posts
- 4,044
- Rep Power
- 0
Forex Analysis & Reviews: EURJPY short-term bullish bounce | 23rd Sep 2021
Price is holding below the descending trendline resistance, however we are expecting price to be making a short-term bullish bounce as price is seen to bounce off the 1st support. We can expect the price to bounce from the 1st Support and ride the bullish momentum towards the 1st resistance in line with 61.8% Fibonacci projection, 61.8% Fibonacci retracement and descending trendline resistance. Our short-term bullish bias is further supported by the MACD indicator where the MACD line cross over the signal line.
Trading Recommendation
Entry: 84.760
Reason for Entry:
78.6% Fibonacci projection
Take Profit: 86.999
Reason for Take Profit:
61.8% Fibonacci projection
Stop Loss: 83.571
Reason for Stop Loss:
127.% Fibonacci Retracement
Analysis are provided by InstaForex
-
24-09-21, 10:20 #5
Veteran Member
Just starting here
- Join Date
- Jun 2013
- Age
- 40
- Posts
- 4,044
- Rep Power
- 0
Forex Analysis & Reviews: USDJPY short-term bearish drop | 24th Sep 2021
Price is holding above the ascending trendline support, however we are expecting the price to be making a short-term bearish drop as price has approached a strong resistance level where price reversed twice at that level. We can expect the price to drop from the 1st Resistance and ride the bearish momentum towards the 1st Support in line with 61.8% Fibonacci Retracement and 78.6% Fibonacci Projection. Our short-term bearish bias is further supported by the Stochastic indicator where the %K line touches the resistance level awaiting for a drop.
Trading Recommendation
Entry: 110.431
Reason for Entry:
127.2% Fibonacci Projection
Take Profit: 109.610
Reason for Take Profit:
61.8% Fibonacci retracement and 78.6% Fibonacci projection
Stop Loss: 110.794
Reason for Stop Loss:
-27.2% Fibonacci Retracement and 161.8% Fibonacci projection
Analysis are provided by InstaForex
-
27-09-21, 09:28 #6
Veteran Member
Just starting here
- Join Date
- Jun 2013
- Age
- 40
- Posts
- 4,044
- Rep Power
- 0
Forex Analysis & Reviews: USDJPY short-term bearish drop | 27th Sep 2021
Price is holding above the ascending trendline support, however we are expecting the price to be making a short-term bearish drop as price has approached a strong resistance level where price reversed thrice at that level. We can expect the price to drop from the 1st Resistance and ride the bearish momentum towards the 1st Support in line with 100% Fibonacci Projection and 78.6% Fibonacci Retracement. Our short-term bearish bias is further supported by the Stochastic indicator where the %D line touches the resistance level awaiting for a drop.
Trading Recommendation
Entry: 110.813
Reason for Entry:
78.6% Fibonacci Projection
Take Profit: 109.120
Reason for Take Profit:
100% Fibonacci Projection and 78.6% Fibonacci Retracement
Stop Loss: 111.652
Reason for Stop Loss:
-61.8% Fibonacci Extension and 127.2% Fibonacci projection
Analysis are provided by InstaForex
-
28-09-21, 09:12 #7
Veteran Member
Just starting here
- Join Date
- Jun 2013
- Age
- 40
- Posts
- 4,044
- Rep Power
- 0
Forex Analysis & Reviews: AUDCAD bullish bounce| 28th Sep 2021
Price is holding above the descending trendline resistance turn support, showing a strong bullish momentum. Price is approaching the trendline support to retest and we can expect price to bounce up from 1st Support in line 127.2% Fibonacci Projection and previous swing low, towards the 1st Resistance in line with 127.2% Fibonacci retracement and 78.6% Fibonacci projection. Our bullish bias is further supported by the Stochastic indicator where the %K line is abiding to a ascending trendline.
Trading Recommendation
Entry: 0.91127
Reason for Entry:
127.2% Fibonacci Projection
Take Profit: 0.93793
Reason for Take Profit:
127.2% Fibonacci Retracement and 78.6% Fibonacci Projection
Stop Loss: 0.90243
Reason for Stop Loss:
161.8% Fibonacci Projection and 127.2% Fibonacci Retracement
Analysis are provided by InstaForex
-
29-09-21, 10:20 #8
Veteran Member
Just starting here
- Join Date
- Jun 2013
- Age
- 40
- Posts
- 4,044
- Rep Power
- 0
Forex Analysis & Reviews: Trading plan for EURUSD for September 29, 2021
Technical outlook:
EURUSD might have carved a higher low around 1.1668 levels on Tuesday before pulling back. The currency could be looking to turn bullish from here and a break above 1.1750 will confirm the same. The counter trend rally still remains possible until prices stay above 1.1660 levels going forward. Bulls remain poised to push higher towards 1.2050 at least.
The recent boundary which is being worked upon is between 1.2266 and 1.1660 levels respectively. Also note that fibonacci 0.618 retracement of the above drop is seen passing through 1.2050-1.2100 zone. If bulls manage to push through the above zone, high probability remains for a turn lower since resistance will be strong.
The bigger picture for EURO remains bearish towards 1.1300, which is the Fibonacci 0.618 retracement of previous rally between 1.0636 and 1.2350 levels respectively. A drop there would warrant potential bullish reversal going forward.
Trading plan:
Potential rally towards 1.2050, against 1.1650.
Good luck!
Analysis are provided by InstaForex
-
30-09-21, 09:49 #9
Veteran Member
Just starting here
- Join Date
- Jun 2013
- Age
- 40
- Posts
- 4,044
- Rep Power
- 0
Forex Analysis & Reviews: GBPJPY bullish bounce| 30th Sep 2021
Price is reacting below the descending trendline resistance on the daily timeframe this shows an overall bearish trend, however we can expect a short-term bullish momentum for the price to bounce back to the resistance level. We can expect the price to bounce from the 1st Support in line with 61.8% Fibonacci Projection and 38.2% Fibonacci Retracement towards the 1st Resistance in line with 61.8% Fibonacci projection. Our bullish bias is further supported by the stochastic indicator where the %K line bounced from the support line.
Trading Recommendation
Entry:149.922
Reason for Entry:
38.2% Fibonacci Retracement and 61.8% Fibonacci projection
Take Profit: 152.161
Reason for Take Profit:
61.8% Fibonacci projection
Stop Loss: 149.156
Reason for Stop Loss:
78.6% Fibonacci projection
Analysis are provided by InstaForex
-
01-10-21, 09:09 #10
Veteran Member
Just starting here
- Join Date
- Jun 2013
- Age
- 40
- Posts
- 4,044
- Rep Power
- 0
Forex Analysis & Reviews: UKOIL facing bearish pressure, drop incoming!
UKOIL is holding below 1st resistance at 79.28 in line with 61.8 Fibonacci retracement and 38.2% Fibonacci extension and may bearish towards 1st support at 76.10 in line 61.8% Fibonacci retracement and 161.8% Fibonacci extension . Our bearish is further supported by how MACD is showing a bearish signal where the signal line is above the MACD line. Otherwise price may bullish towards 2nd resistance at 80.72 in line with Horizontal swing high and 61.8% Fibonacci extension.
Trading Recommendation
Entry: 79.28
Reason for Entry:
61.8 Fibonacci retracement and 38.2% Fibonacci extension
Take Profit: 76.10
Reason for Take Profit:
61.8% Fibonacci retracement and 161.8% Fibonacci extension
Stop Loss: 80.72
Reason for Stop Loss:
Horizontal swing high and 61.8% Fibonacci extension.
Analysis are provided by InstaForex
-
04-10-21, 10:04 #11
Veteran Member
Just starting here
- Join Date
- Jun 2013
- Age
- 40
- Posts
- 4,044
- Rep Power
- 0
Forex Analysis & Reviews: Elliott wave analysis of Ripple for October 4, 2021
Ripple has completed sub-wave ii near 0.8560. We are looking for an upside acceleration towards 2.3227 in sub-wave iii where a sideways consolidation is expected.
In the long term, upward movement to 3.3170 and higher is expected. In the short term, a break above minor resistance at 1.1300 and ideally above resistance at 1.2400 may occur. If so, the digital asset may rise to 1.4160, 1.9665, and 3.3170.
Analysis are provided by InstaForex
-
05-10-21, 09:29 #12
Veteran Member
Just starting here
- Join Date
- Jun 2013
- Age
- 40
- Posts
- 4,044
- Rep Power
- 0
Forex Analysis & Reviews: USDCHF bullish continuation | 5th Oct 2021
Price is holding above the ascending trendline support, signifying a bullish momentum. We can expect the price to push up from the pivot level in line with 23.6% Fibonacci retracement towards the take profit level in line with 61.8% Fibonacci projection and 61.8% Fibonacci retracement. Our bullish bias is further supported by the stochastic indicator where the %K line bounced at the support level.
Trading Recommendation
Entry: 0.92572
Reason for Entry:
23.6% Fibonacci Retracement
Take Profit: 0.93326
Reason for Take Profit:
61.8% Fibonacci Retracement and 61.8% Fibonacci projection
Stop Loss: 0.92329
Reason for Stop Loss:
127.2% Fibonacci projection
Analysis are provided by InstaForex
-
06-10-21, 09:35 #13
Veteran Member
Just starting here
- Join Date
- Jun 2013
- Age
- 40
- Posts
- 4,044
- Rep Power
- 0
Forex Analysis & Reviews: EUR/USD pair has not implemented growth yet
A lack of major support from the ECB is indicated by today's Asian trading session. If the situation does not change, then the probability of updating the monthly low will increase to 80%.
When making a trading plan, it is worth noting that yesterday's closing level may become a determining resistance if the European session opens below the level of 1.1596. Trading in a downward direction is regaining its status as the priority. So, one must get ready for another bearish momentum. The first downward target is to update the monthly low. The main target is the Weekly Control Zone of 1.1540-1.1523.
This pattern will be the main one if the activity during the European session allows the price to stay below the level of 1.1596. The task is to join stronger players who will buy the euro at more favorable prices at a monthly low and below.
Analysis are provided by InstaForex
-
07-10-21, 09:17 #14
Veteran Member
Just starting here
- Join Date
- Jun 2013
- Age
- 40
- Posts
- 4,044
- Rep Power
- 0
Forex Analysis & Reviews: Elliott wave analysis for Natural Gas for October 7, 2021
Natural gas article from September 15
Yesterday, natural gas peaked at 6.46. It is time for a correction towards 5.26 and maybe even closer to 4.75 before the natural gas can take off again to way above the peak at 6.46.
Inflation may weigh on the economic recovery. Once the correction in crude oil and natural gas is completed and prices rise to new highs, it will become much more painful to the global economies.
Analysis are provided by InstaForex
-
08-10-21, 09:23 #15
Veteran Member
Just starting here
- Join Date
- Jun 2013
- Age
- 40
- Posts
- 4,044
- Rep Power
- 0
Forex Analysis & Reviews: AUDUSD bearish continuation | 8th Oct 2021
Price is holding below the descending trendline resistance, signifying a bearish momentum. We can expect the price to continue to push down towards the 1st Support in line with 61.8% Fibonacci projection and 61.8% Fibonacci Retracement. Our bearish support is further supported by the stochastic indicator where the %K line drops from the resistance level.
Trading Recommendation
Entry: 0.73249
Reason for Entry:
50% Fibonacci retracement and Graphical overlap resistance
Take Profit: 0.72225
Reason for Take Profit:
61.8% Fibonacci Retracement and 61.8% Fibonacci projection
Stop Loss: 0.74078
Reason for Stop Loss:
61.8% Fibonacci projection and 78.6% Fibonacci retracement
Analysis are provided by InstaForex
-
11-10-21, 09:56 #16
Veteran Member
Just starting here
- Join Date
- Jun 2013
- Age
- 40
- Posts
- 4,044
- Rep Power
- 0
Forex Analysis & Reviews: AUDUSD bearish continuation | 11th Oct 2021
Price is holding below the descending trendline resistance, signifying a bearish momentum. We can expect the price to continue to push down towards the 1st Support in line with 78.6% Fibonacci projection and 61.8% Fibonacci Retracement. Our bearish support is further supported by the stochastic indicator where the %K line drops from the resistance level.
Trading Recommendation
Entry: 0.73454
Reason for Entry:
61.8% Fibonacci retracement and 100% Fibonacci Projection
Take Profit: 0.72230
Reason for Take Profit:
78.6% Fibonacci projection and 61.8% Fibonacci Retracement
Stop Loss: 0.74127
Reason for Stop Loss:
61.8% Fibonacci projection and 78.6% Fibonacci retracement
Analysis are provided by InstaForex
-
12-10-21, 09:28 #17
Veteran Member
Just starting here
- Join Date
- Jun 2013
- Age
- 40
- Posts
- 4,044
- Rep Power
- 0
Forex Analysis & Reviews: Trading plan for EUR/USD on October 12, 2021
TECHNICAL OUTLOOK:
EUR/USD remained subdued in the past two trading sessions, but managed to hold above the 1.1530 intermediate support. The currency pair could be preparing to produce a counter trend rally, extending towards the 1.1900-1.2000 zone in the near term. Even if another low is print below the 1.1530 mark, downside risk remains limited for now.
EUR/USD earlier dropped from the 1.2266 highs through the 1.1530 levels, carving a meaningful bearish boundary. Bulls might be poised to retrace the above mentioned drop and push the price towards the 1.1900-1.2000 zone, before it reverses again. Only a consistent break below 1.1530 would drag the price further towards the 1.1300 mark; probability remains grim though.
EUR/USD is seen to be trading around the 1.1562 levels at this point of writing and is preparing to produce a meaningful corrective rally in the near term. The immediate price resistance is seen at 1.1640, while the interim support is around the 1.1500 levels. A break above 1.1640 will confirm that bulls are back in control.
TRADING PLAN:
Potential rally towards 1.1900-1.2000 against 1.1450 Good luck!
Analysis are provided by InstaForex
-
13-10-21, 09:20 #18
Veteran Member
Just starting here
- Join Date
- Jun 2013
- Age
- 40
- Posts
- 4,044
- Rep Power
- 0
Forex Analysis & Reviews: USDJPY short-term bearish pressure | 13th Oct 2021
We can see that price is abiding by the ascending trendline and we can see price has reached the 1st resistance hence, we can expect the price to reverse back down to the 1st Support in line with the 50% Fibonacci retracement , 100% Fibonacci projection and ascending trendline support. Our short-term bearish bias is further supported by the RSI indicator where it touched the resistance level and dropped.
Trading Recommendation
Entry: 113.827 Reason for Entry:
100% Fibonacci Projection
Take Profit: 112.146
Reason for Take Profit:
100% Fibonacci projection and 50% Fibonacci Retracement
Stop Loss: 114.581
Reason for Stop Loss:
Horizontal swing high, 127.2% Fibonacci projection
Analysis are provided by InstaForex
-
14-10-21, 09:50 #19
Veteran Member
Just starting here
- Join Date
- Jun 2013
- Age
- 40
- Posts
- 4,044
- Rep Power
- 0
Forex Analysis & Reviews: Elliott wave analysis of gold for October 14, 2021
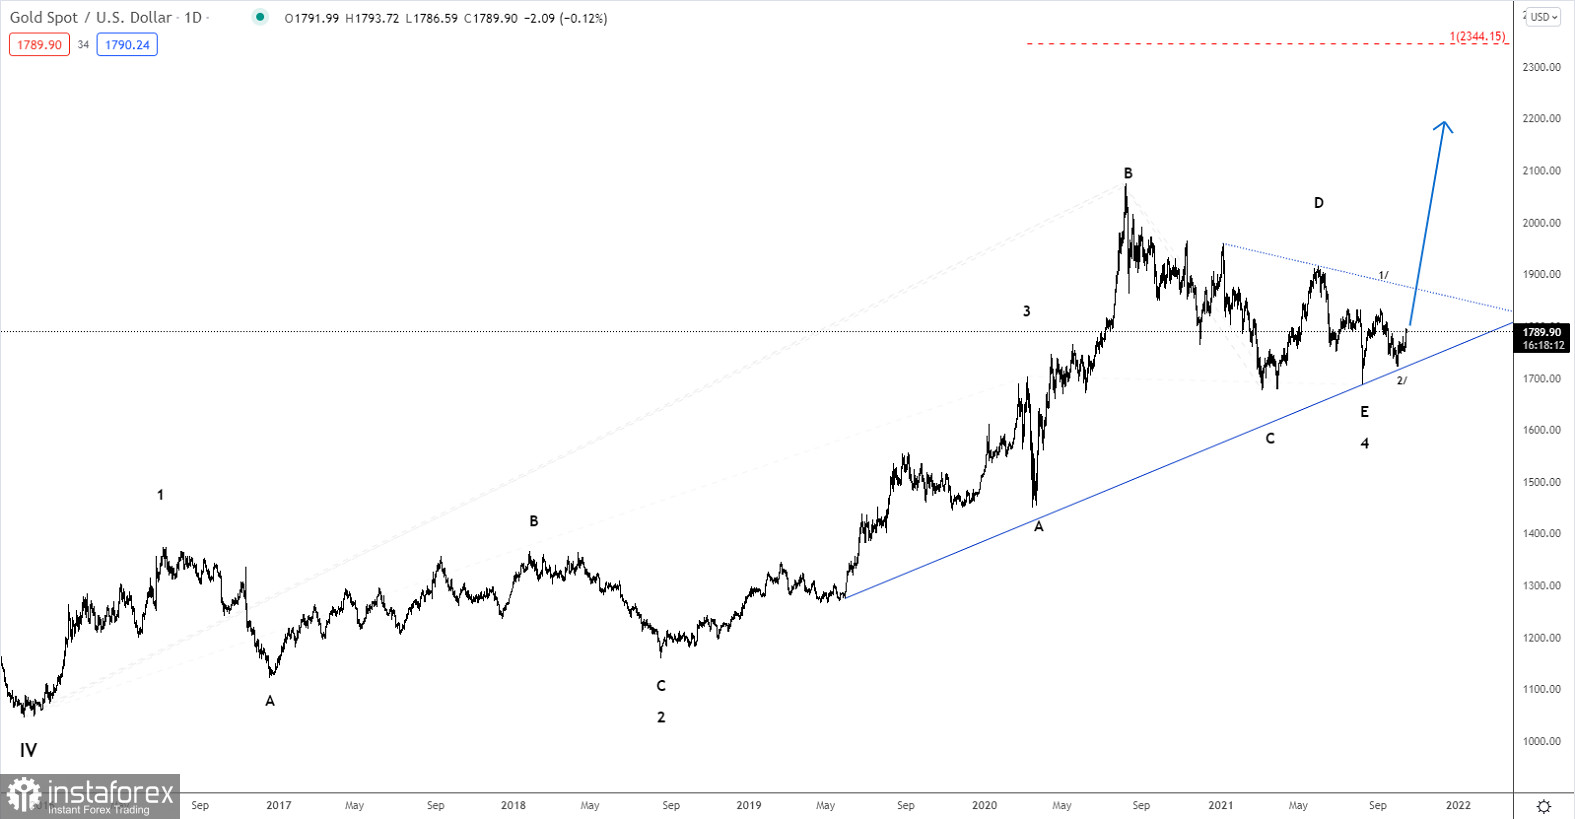
Gold is ready to challenge minor resistance at 1,834 again. It is likely to break higher towards key resistance at 1,917. A break above here will finally confirm that the triangle consolidation we have witnessed in the last 13 months has been completed and the next impulsive rally towards 2,344 is in motion.
In the short term, we see support at 1,750 that ideally will be able to act as a floor for the rally to and above minor resistance at 1,834.
Analysis are provided byInstaForex.
-
15-10-21, 08:24 #20
Veteran Member
Just starting here
- Join Date
- Jun 2013
- Age
- 40
- Posts
- 4,044
- Rep Power
- 0
Forex Analysis & Reviews: Forecast for EUR/USD on October 15, 2021
EUR/USD
Yesterday, the euro closed the day with a symbolic growth of 1 point, the peak growth was 30 points, so yesterday can be considered corrective. US retail sales data for September are due tonight, forecast at -0.3%. In the euro area, an increase in the trade balance for August is expected from 13.4 billion euros to 15.3 billion. The euro will likely rise. The growth target is the MACD line in the 1.1668 area.
On the four-hour scale, the Marlin Oscillator was discharged from the overbought zone yesterday, now it is ready to continue rising. The correction developed above the balance indicator line, which means that investors are still interested in buying.
Analysis are provided by InstaForex

 Reply With Quote
Similar Threads
-
Forex News from InstaForex
By InstaForex Gertrude in forum Advertisement PlaceReplies: 2103Last Post: 16-02-24, 10:27 -
Forex Technical & Market Analysis FXCC
By alayoua in forum Advertisement PlaceReplies: 4Last Post: 07-07-16, 00:25 -
Weekly technical analysis for 3 - 7.12, 2012
By bellalca in forum Affiliate program networksReplies: 0Last Post: 04-12-12, 07:09


Bookmarks