
Results 1,341 to 1,360 of 2158
Thread: Instaforex Analysis
-
13-11-20, 08:07 #1341
 Veteran Member
Just starting here
Veteran Member
Just starting here

- Join Date
- Jun 2013
- Age
- 40
- Posts
- 4,044
- Rep Power
- 0

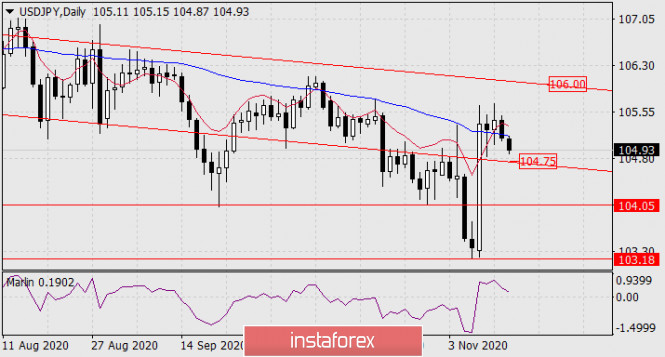
]Forecast for USD/JPY on November 13, 2020
USD / JPY
The Japanese yen, under yesterday's pressure from the stock market, strengthened (decreased on the chart) by 29 pips, breaking the support of the MACD line on the daily chart. Then, today during the Asian session, the USD / JPY pair lost the same amount, and in order for the quotes to continue the decline, the bears have to overcome the support of the price channel at 104.75. Around the same time, the Marlin Oscillator will move into negative territory, which will strengthen the declining market sentiment. The target of the movement will be the level of 104.05, which is near the lows reached on October 29 and September 21.
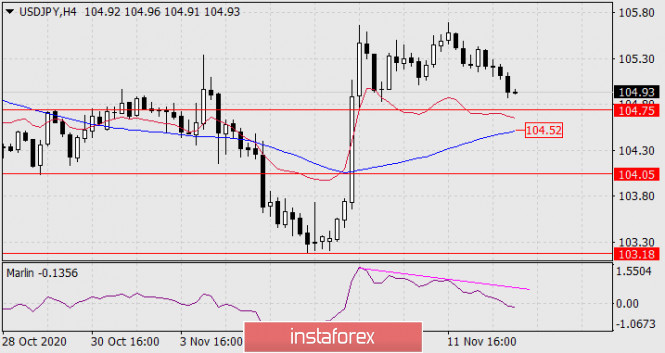
The four-hour chart shows that the MACD line (104.52) is located slightly below the level of 104.75. Therefore, to ensure that the pair does not fall under the price channel, the quotes have to fall below the MACD line. Converging the price with the Marlin Oscillator will be effective for this, especially since at the moment, the signal line has already entered the zone of negative values. The prevailing scenario is bearish, and a consolidation below 104.05 will certainly trigger a downward move towards 103.18.
Analysis are provided byInstaForex.
-
16-11-20, 08:12 #1342
Veteran Member
Just starting here
- Join Date
- Jun 2013
- Age
- 40
- Posts
- 4,044
- Rep Power
- 0
Technical Analysis of ETH/USD for November 16, 2020
Crypto Industry Outlook:
Binance CEO Changpeng Zhao said he needed to do more to block "smart" US traders from illegally accessing its global stock exchange. In an interview with the financial media, CZ said its stock exchange needs to be "smarter about the way we block" US traders from accessing the platform:
"Basically, we are constantly trying to improve our security. Sometimes there are a few guys who want to bypass our locks and still use the platform. We have to come up with a smarter way to strengthen protection, and when we do, we lock them."
Binance, which is the world's largest cryptocurrency exchange by volume, stopped serving US traders in September 2019 due to regulatory risk. The stock market later launched Binance.US in partnership with BAM Trading Services, which was approved by the Financial Crimes Enforcement Network to serve US clients. Binance.US is a separate entity that licenses technology from Binance and receives brand support from the Malta Stock Exchange.
Binance.US transaction volumes are said to be only a small fraction of the daily turnover on the main Binance exchange. However, reported volumes are often inflated and do not reflect actual trading activity. It is said that the big stock exchanges continue to publish false figures.
Technical Market Outlook:
The ETH/USD pair has been seen moving lower towards the level of $440 after the corrective cycle had started. The local low was made at the level of $438.18, but the market keeps moving inside of the descending channel. The outlook remains bullish and the next target for bulls is the swing high located at the level of $476.29. The nearest technical resistance is seen at the level of $459.47. Only if a daily candle closes below $360 level, then the bears will have full control of the market and might push the prices deeper below this level.
Weekly Pivot Points:
WR3 - $507.71
WR2 - $490.25
WR1 - $463.71
Weekly Pivot - $448.80
WS1 - $421.33
WS2 - $405.66
WS3 - $377.90
Trading Recommendations:
The up trend on the Ethereum continues and the next long term target for ETH/USD is seen at the level of $500, so any correction or local pull-back should be used to open the buy orders. This scenario is valid as long as the level of $309.61 is broken.
Analysis are provided by InstaForex
-
17-11-20, 07:59 #1343
Veteran Member
Just starting here
- Join Date
- Jun 2013
- Age
- 40
- Posts
- 4,044
- Rep Power
- 0
Forecast for EUR/USD on November 17, 2020
EUR/USD
Markets continue to actively play out the popular topic of coronavirus vaccines. Yesterday, American company Moderna announced successful tests of the second phase. The US stock index S&P 500 rose by 1.16%, the euro by 17 points. Obviously, until new investment topics are available, investors continue to be optimistic about the development of new vaccines and the vaccination process itself. But this topic will soon become boring, because yesterday's growth was not as pronounced as it was after the news from Pfizer.
The daily chart shows that nothing is holding back the price from moving to the nearest targets of 1.1910 along the MACD line and 1.1940 along the line of the descending price channel. The Marlin oscillator is growing.
The four-hour chart shows that the price settled above the balance indicator line, which strengthened the mood for buy positions on the euro, the Marlin oscillator also settled in the positive trend zone. Yesterday's trading volume exceeded Friday's. We are waiting for the EUR/USD to rise towards the designated targets.
Analysis are provided by InstaForex
-
18-11-20, 08:25 #1344
Veteran Member
Just starting here
- Join Date
- Jun 2013
- Age
- 40
- Posts
- 4,044
- Rep Power
- 0
AUD/USD Forecast for November 18, 2020
AUD / USD The Australian Dollar lost 20 points yesterday. Yesterday's peak allowed us to form a divergence with the Marlin oscillator. To fix it and actually turn the market down, the price needs to be fixed under the Kruzenshtern line-- below 0.7264-- and then fall below the nearest target level of 0.7222 at least on November 12-13. The nearest target is 0.7120.
On the four-hour chart, the price is already attacking the Kruzenshtern line at 0.7275. Note that the Krusenstern lines on both time charts almost coincide in price, which makes the 0.7264/75 range particularly important.
Fixing under the specified range can trigger a strong drop in the price. The signal line of the Marlin oscillator on H4 has already entered the zone of negative values. The probability of a downward scenario is 80%.
Analysis are provided by InstaForex
-
20-11-20, 08:20 #1345
Veteran Member
Just starting here
- Join Date
- Jun 2013
- Age
- 40
- Posts
- 4,044
- Rep Power
- 0
Forecast for EUR/USD on November 20, 2020
EUR/USD
Yesterday, the euro showed increased dynamics on average trading volumes, the range was 68 points. The support was provided by the balance and MACD indicator lines on the four-hour chart. The Marlin oscillator did not manage to gain a foothold in the bears' territory and went back to the growth area. We have a rising trend on the four-hour chart. The nearest target 1.1903 is the MACD line on the daily chart.
The daily chart shows that the situation also tends to rise, but the resistance of the MACD line looks strong, the price has pulled back from it twice in the last three days.
If the euro gathers strength, it is possible to overcome the 1.1903 level and even reach the border of the price channel at 1.1938, but further growth is possible only with strong fundamental factors. In this case, the target is the 1.2010/40 range.
In general, the euro confirmed that it is not going to leave the wide free roaming zone of 1.1750-1.1930. We are waiting for the development of events.
Analysis are provided by InstaForex
-
23-11-20, 07:57 #1346
Veteran Member
Just starting here
- Join Date
- Jun 2013
- Age
- 40
- Posts
- 4,044
- Rep Power
- 0
Forecast for EUR/USD on November 23, 2020
EUR/USD
The euro settled below the MACD indicator line on the daily chart for the last two days. A pronounced consolidation provides more prerequisites for overcoming the resistance of the MACD line (1.1902), which will help the euro reach the upper border of the downward price channel on a weekly scale (1.1936) and even to its breakout with the subsequent target at 1.2010. And from a fundamental point of view, this scenario is reinforced by the next postponement of the Brexit deadline to December 10, which is when the Brexit deal is expected to be adopted at the EU summit. The agreement itself may be ready by November 30th.
The Marlin oscillator does not provide hints on the daily scale, it moves horizontally.
The four-hour chart shows that Marlin is turning upward from the border of the bears' territory, the price is developing above the balance and MACD lines, which ultimately increases the likelihood of rising further to about 60%.
The growing market sentiment may be shaken when the price settles below the MACD line at the four-hour chart, below 1.1840 to be more specific. The 1.1750 target level will become relevant again. We are waiting for the development of events.
Analysis are provided by InstaForex
-
24-11-20, 08:13 #1347
Veteran Member
Just starting here
- Join Date
- Jun 2013
- Age
- 40
- Posts
- 4,044
- Rep Power
- 0
Forecast for AUD/USD on November 24, 2020
AUD/USD
The Australian dollar lost 15 points under the overall optimistic pressure of the US dollar on Monday. But while the Australian currency is in no hurry to leave the range of the last six trading sessions, it needs to make sure that the market intends to further strengthen the US currency. During this waiting time, even if it does not work out the upper target of 0.7380, AUD/USD can form a double divergence with the Marlin oscillator. The most important economic data for Australia will only be available next week, such as Quarter 3 GDP, trade balance, PMI, and construction. Since the RBA meeting will take place on Tuesday, December 1, the "kangaroo" can feel quite free until the end of the week.
On the four-hour chart, the price consolidated under the MACD indicator line, the Marlin oscillator briefly went into the negative zone, and this morning it is trying to get back into the growth zone. Neutrality is also observed here on the four-hour scale. It still waits for the price to fall below the level of 0.7260, which is under the daily MACD line.
Analysis are provided by InstaForex
-
25-11-20, 08:46 #1348
Veteran Member
Just starting here
- Join Date
- Jun 2013
- Age
- 40
- Posts
- 4,044
- Rep Power
- 0
AUSTRALIA CONSTRUCTION WORK FALLS 2.6% IN Q3
The total value of construction work done in Australia was down a seasonally adjusted 2.6 percent on quarter in the third quarter of 2020, the Australian Bureau of Statistics said on Wednesday - coming in at A$51.179 billion.
That missed expectations for a fall of 2.0 percent following the 0.7 percent decline in the previous three months.
On a yearly basis, the value of construction was down 4.2 percent.
Building work was down 2.0 percent on quarter and 7.2 percent on year at A$28.971 billion.
Residential work was down 1.0 percent on quarter and 8.9 percent on year, while non-residential work fell 3.4 percent on quarter and 4.5 percent on year. Engineering work sank 3.3 percent on quarter but gained 0.1 percent on year.
News are provided by InstaForex
-
26-11-20, 07:42 #1349
Veteran Member
Just starting here
- Join Date
- Jun 2013
- Age
- 40
- Posts
- 4,044
- Rep Power
- 0
Forex Analysis & Reviews: AUD/USD Forecast for November 26, 2020
AUD/USD
The Australian Dollar was ready yesterday to turn from the target resistance 0.7380, a decline of 50 points, but the European currencies showed the optimism of American investors out of the market before today's holiday. As a result the Aussie closed the day up 5 points. The potential for divergence formation on the daily chart remains. The level of 0.7380 has not been overcome but the probability of this has increased. The target in this case is the 0.7440 level.
On the four-hour chart, the price punctured the Kruzenshtern line twice yesterday but this was in a growing trend, as the price remained above the balance indicator line. The signal line of the Marlin oscillator has created a wedge-shaped structure, from which an upward exit is expected.
So, with a probability of 80%, the price is likely to go above the level of 0.7380 and further increase to 0.7440.
Analysis are provided by InstaForex
-
27-11-20, 08:26 #1350
Veteran Member
Just starting here
- Join Date
- Jun 2013
- Age
- 40
- Posts
- 4,044
- Rep Power
- 0
Forex Analysis & Reviews: Forecast for EUR/USD on November 27, 2020
EUR/USD
In the absence of American investors in the market, the euro did not dare to overcome the important resistance of the upper line of the price channel on the daily chart on Thursday. Confusion made it possible for a divergence reversal to form with the Marlin oscillator. European stock indexes also showed no desire to rise yesterday, the main ones closed the day with a slight decline. Obviously, the markets will not grow today either, as any negotiations between the UK and the EU on Brexit may end on Monday.
At the moment, the daily price is between the MACD line and the price channel line. The price can't go up, but now it can slightly go down on closing long positions. Direct short deals on the euro may begin next week.
The four-hour chart shows that the price is still receiving support from the MACD line, but the signal line of the Marlin oscillator did not rise from its own range (gray rectangle), as we expected yesterday, but now this line can go down from the range. A signal to open short positions is when the price falls below yesterday's low of 1.1885.
Analysis are provided by InstaForex
-
30-11-20, 08:37 #1351
Veteran Member
Just starting here
- Join Date
- Jun 2013
- Age
- 40
- Posts
- 4,044
- Rep Power
- 0
Forex Analysis & Reviews: Gold price breaks $1,800
Gold is trading below $1,800 and today it made a new lower low at $1,773. In our latest Gold analysis when price was trading near $1,810-20 resistance area by the bearish channel, we noted the bearish flag pattern and that we expect Gold price to move to new lows towards $1,770-50. The upper side of the target range has been reached today.
Blue lines - bearish channel
Gold price is moving lower in a textbook style as price gets rejected at the upper channel boundary resistance and breaks lower towards $1,770. Trend is clearly bearish and no sign of reversal yet. Gold price will most probably continue lower. A bounce towards $1,800 is not out of the question but it would not be something we would bet on.
Analysis are provided by InstaForex
-
01-12-20, 07:56 #1352
Veteran Member
Just starting here
- Join Date
- Jun 2013
- Age
- 40
- Posts
- 4,044
- Rep Power
- 0
Forex Analysis & Reviews: Forecast for EUR/USD on December 1, 2020
EUR/USD
According to news agencies, stock market participants took profits yesterday, due to which the S&P 500 fell by 0.46%, and the Dow Jones -0.91%. Trading volumes were large, a sign of flight from the stock market before the announcement of the UK's exit from the EU without a deal. The euro lost 35 points on the same expectations, falling from the day's high with 77 points. The price slightly fell short of the target level 1.2010/40. Divergence on the daily chart is gaining strength
Taking the high volumes of yesterday's trading into account, which were the highest for the euro over the past two weeks, investors are unlikely to want to try to take it a second time. Now we are waiting for the price to move under the MACD line (1.1896) and the attack on support at 1.1750. If successful, it will be followed by - reaching the lower embedded line of the price channel in the 1.1620 area.
The four-hour chart shows that the signal line of the Marlin oscillator has returned to the lower border of its own range. At the same time, the price reached the support of the MACD indicator line. Since the price overcame yesterday's low of 1.1926, it is possible to open short deals while aiming for 1.1750 and 1.1620.
Analysis are provided by InstaForex
-
02-12-20, 07:48 #1353
Veteran Member
Just starting here
- Join Date
- Jun 2013
- Age
- 40
- Posts
- 4,044
- Rep Power
- 0
Forex Analysis & Reviews: Forecast for AUD/USD on December 2, 2020
AUD / USD
The Australian dollar does not share the great optimism of European currencies and went up by only 27 points yesterday, remaining in the range of Monday until this morning. Even on today's GDP data for the 3rd quarter that showed growth of 3.3% against expectations of 2.5%, the "Aussie" did not react and the price is in no hurry to overcome the target level at the resistance of 0.7380.
Yesterday's RBA meeting was cautiously negative as the regulator does not expect the economy to recover until the end of next year. It is very possible that this definition includes a version of a hard Brexit. The double divergence of the price with the oscillator on the daily scale remains. We are waiting for a reversal in the target range of 0.7222 / 52 in the area of the Kruzenshtern line and the price level of the minimum on November 12.
Based on the four-hour chart, the price stopped at the Kruzenshtern line, which strengthened the level of 0.7380. The Marlin oscillator is held in the downward trend zone. Commodities and metals were cheaper yesterday and today keeping the Australian dollar from rising during a period of uncertainty in Europe. We are waiting for a slow decline in the Australian currency to 0.7340 with the overcoming of the level, the fall may accelerate.
Analysis are provided by InstaForex
-
03-12-20, 08:20 #1354
Veteran Member
Just starting here
- Join Date
- Jun 2013
- Age
- 40
- Posts
- 4,044
- Rep Power
- 0
Forex Analysis & Reviews: Forecast for AUD/USD on December 3, 2020
AUD/USD
The Australian dollar managed to show yesterday another maximum of the last 3 months, which was caused by the growth of the Euro. But this "Australian" strengthened only the spring that is preparing to push down the Marlin divergence has already become triple. The decline target is seen in the range of 0.7222 / 52, formed by the November 12 low and the Kruzenshtern line.
Based on the four-hour chart, the price is fixed above both the indicator lines - the balance line and the Kruzenshtern line, Marlin indicates growth. But here we see a repeat of the situation in recent weeks, when the price was freely wound on this indicator line in a relatively thin speculative market.
Fixing the price below 0.7384 could mean a start to overcome the level of 0.7340, which will already reveal the downward potential to the full. It is worth noting that the Australian dollar did not react to the excellent trade balance of Australia published this morning and the trade balance for October was 7.46 billion dollars against the forecast of 5.83 billion. Exports increased by 5.0%.
Analysis are provided by InstaForex
-
04-12-20, 08:02 #1355
Veteran Member
Just starting here
- Join Date
- Jun 2013
- Age
- 40
- Posts
- 4,044
- Rep Power
- 0
Forex Analysis & Reviews: Forecast for EUR/USD on December 4, 2020
EUR/USD
Brexit negotiations are ongoing. Only one agreement reached - to extend the negotiations over the weekend. As a result of this, the dollar index added 0.37%, the euro 32 points. Today we can expect data on labor in the US for November, unemployment is expected to drop from 6.9% to 6.8%, perhaps these data can stop the euro's growth. If investors do not close their long positions today, then they may suffer losses on Monday.
The euro has gone above the target level of 1.2117, reaching the upper level of 1.2230 is questionable, since the Marlin oscillator is turning down on the daily chart. Getting the price to settle under 1.2117 will mean a quick attack on the support line of the price channel at 1.2040, and going under it - falling further to 1.1922 - toward the MACD line.
The signal line of the Marlin oscillator has formed a triple top on the four-hour chart, which is a trend reversal pattern. Getting the price to settle below 1.2117 will make it possible for the price to attack the strong support at 1.2040 formed by the trend line of the higher chart, the low on December 2, approaching the level of the MACD line. Overcoming important support opens the way to 1.1922. We are waiting for the outcome of the Brexit negotiations.
Analysis are provided by InstaForex
-
07-12-20, 07:28 #1356
Veteran Member
Just starting here
- Join Date
- Jun 2013
- Age
- 40
- Posts
- 4,044
- Rep Power
- 0
Forex Analysis & Reviews: Gold to end the week near intra weekly highs.
Gold price made another attempt towards $1,850 today but price got rejected once again. Bulls should get worried if after a rejection price moves away too far from $1,850. Bulls should be worried if after the rejection price breaks below short-term support of $1,820.
Blue rectangle - resistance area
Black lines -Fibonacci retracements
Gold price is trading near but below the key resistance of $1,850-60. This area was once key support and is now key resistance. I do not expect Gold to break this level, at least not now. I believe we will first see a pull back at least towards the 38% Fibonacci level if not towards the 61.8% before the resumption of the bullish move that started last week at $1,763. At current levels I prefer to be neutral if not bearish. Before weekend I avoid opening new positions. That is why I prefer to wait and see how Monday starts before jumping in the market and before choosing sides.
Analysis are provided by InstaForex
-
08-12-20, 07:58 #1357
Veteran Member
Just starting here
- Join Date
- Jun 2013
- Age
- 40
- Posts
- 4,044
- Rep Power
- 0
Forex Analysis & Reviews: Forecast for GBP/USD on December 8, 2020
GBP/USD
The pound fell by 217 points due to yesterday's news about Prime Minister Boris Johnson's readiness to end the hopeless negotiation process on Brexit. Subsequently, the price won back most of the fall, and the day closed with a black candlestick at 58 points. The MACD line stopped the fall. If the negative Brexit scenario is confirmed (we consider it as the main one), a second attempt to attack the MACD line will be more successful, the target is the 1.3180 level.
The actual target will be the 1.3108 level (November 12 low). The double divergence according to Marlin has worked out, the signal line of the oscillator is about to move into the downward trend zone, which will strengthen the bearish market sentiment.
The four-hour chart shows that the price has settled below the MACD line, yesterday's growth fell slightly short of this line and a reversal is taking place this morning. The first target for support is 1.3290, getting the pair to settle below it will strengthen the decline.
Analysis are provided by InstaForex
-
11-12-20, 09:16 #1358
Veteran Member
Just starting here
- Join Date
- Jun 2013
- Age
- 40
- Posts
- 4,044
- Rep Power
- 0
Forex Analysis & Reviews: Trading signal for GBP/USD for December 10-11, 2020. Focus on Brexit.
British Prime Minister Boris Johnson, European Commission President Ursula von der Leyen and their negotiating teams did not achieve a much-desired breakthrough on Brexit. After concluding that they remain "very separate," the EU and the UK agreed to extend the talks until the end of the weekend. This can further weaken the British pound if they do not reach a deal before the transition period expires.
As talks continue in Brussels, the news is likely to move the British pound. Due to this, the British pound is under downward pressure on the 4-hour technical chart. However, it is facing an upward channel on the 4-hour timeframe and at the 200-day EMA.
Looking up, the resistance is at 1.3360, where the 21-period moving average is located, followed by 1.3427, 6/8 Murray. At the upper target of 1.3549 (7/8 Murray), we should wait until the pound breaks above the 21 day EMA. If so, we can place buy positions with a final target at 1.3670. This boost is sure to appear if good news about Brexit is released.
We gave detailed recommendations and made analysis on Monday and Tuesday. We will leave the links below so that you can review our statistics on GBP/USD. Now if you open a bearish position, you can still hold it until the price touches the 200-day EMA. If the price bounces in this area, we can expect a new upward momentum. If the bearish trend is too strong, we recommend selling the pair with targets at 1.3180 and 1.3060.
The market sentiment in the early American session shows that there are 56% of investors who are selling the pound sterling. If this figure decreases, we could see a bearish breakout of the key level of 1.3220, and the price could fall to the area of 1.3060 in the coming days. So please be careful if you enter the market with to buy. The last opportunity to buy is above the 200 EMA, below this level, the downward pressure may accelerate.
Trading tip for GBP/USD for December 10 11
Buy above 1.3360 (EMA 21), with take profit at 1.3427, stop loss below 1.3320.
Buy if the pair rebounds around 1.3255 (trend channel), with take profit at 1.3310 and 1.3360, stop loss below 1.3210.(EMA 200)
Buy if the pair rebounds around 1.3220 (EMA 200), with take profit at 1.3270 and 1.3305 (5/8), stop loss below 1.3180.
Review our analysis for December 08, GBP/USD.
Review our analysis for December 09, GBP/USD.
Analysis are provided by InstaForex
-
14-12-20, 08:53 #1359
Veteran Member
Just starting here
- Join Date
- Jun 2013
- Age
- 40
- Posts
- 4,044
- Rep Power
- 0
Forex Analysis & Reviews: Forecast for EUR/USD on December 14, 2020
EUR/USD
Prime Minister Boris Johnson's Sunday talks with Ursula von der Leyen ended in the fact that the deadline for the talks was postponed until December 31. It is not entirely clear how the ratification of the agreement will take place, but we believe that with this decision, the parties decided to disguise and soften Brexit without a deal, so as not to bring down the markets and shock the population.
The daily chart shows that the price is staying closer to the upper level of 1.2175, rather than to the support of 1.2037, so there is still a possibility of reaching the upper target of 1.2230 with the divergence forming with the Marlin oscillator. When the price approaches the support of the embedded line of the price channel (1.2037), it will strengthen the option of a reversal from the current levels, without preliminary growth. The current situation is neutral.
The four-hour chart shows that the price has settled below the MACD line, but the signal line of the Marlin oscillator makes an attempt to enter the growth area, and this situation does not provide any advantage to any of the scenarios, the probability of growth and decline is the same.
Analysis are provided by InstaForex
-
15-12-20, 08:30 #1360
Veteran Member
Just starting here
- Join Date
- Jun 2013
- Age
- 40
- Posts
- 4,044
- Rep Power
- 0
Forex Analysis & Reviews: Forecast for AUD/USD on December 15, 2020
AUD/USD
Over the past day, the situation for the Australian Dollar has not changed. The quote is at the closing level of Friday last week. But in the technical picture, this increased the reversal potential. On the daily scale chart, the divergence from the Marlin oscillator becomes more distinct. To maintain this scenario, the price will need to be fixed under the nearest support of 0.7500.
The four-hour chart has its own divergence, which increases the probability of a reversal from the current levels.
With the price moving below 0.7500 (December 2017 low), the target of 0.7440 opens with intermediate support on the Kruzenshtern line at 0.7468. I think that in the current situation, we can overcome this line without difficulty. If the price moves below 0.7440, the next target would be at 0.7340.
Analysis are provided by InstaForex

 Reply With Quote
Similar Threads
-
Forex News from InstaForex
By InstaForex Gertrude in forum Advertisement PlaceReplies: 2103Last Post: 16-02-24, 10:27 -
Forex Technical & Market Analysis FXCC
By alayoua in forum Advertisement PlaceReplies: 4Last Post: 07-07-16, 00:25 -
Weekly technical analysis for 3 - 7.12, 2012
By bellalca in forum Affiliate program networksReplies: 0Last Post: 04-12-12, 07:09


Bookmarks