
Results 1,181 to 1,200 of 2158
Thread: Instaforex Analysis
-
19-02-20, 06:51 #1181
 Veteran Member
Just starting here
Veteran Member
Just starting here

- Join Date
- Jun 2013
- Age
- 40
- Posts
- 4,044
- Rep Power
- 0

What are the major institutions trading? | Weekly Commitment of Traders (COT) report (17/2 to 21/2)
On the H4 chart, the price crossed both indicator support lines - the balance line (red) and the MACD line (blue). Marlin is declining in the negative trend zone. The Australian dollar will continue to decline.
Our strongest currency is the US Dollar with a bullish strength factor of 1.73 and with institutions adding more long contracts.
Our weakest currency is the New Zealand Dollar with a bearish strength factor 1.43 and with a net bearish positions of 2,287 meaning that there are a lot of institutions adding on to their short positions (2,983) while at the same time, reducing their long positions (-696).
With a weak NZD and a strong USD, it would be good to look for short NZD/USD positions for this week.
Also worth noting are the weak Japanese Yen, Australian Dollar and the strong Euro, Pound and Canadian dollar.
Analysis are provided by InstaForex
-
20-02-20, 06:24 #1182
Veteran Member
Just starting here
- Join Date
- Jun 2013
- Age
- 40
- Posts
- 4,044
- Rep Power
- 0
Forecast for EUR/USD on February 20, 2020
EUR/USD
The euro gained 13 points on Wednesday as part of a moderate expected correction after the previous three-figure fall. The growth could have been greater, but this was hindered by the fall of the British pound and the Japanese yen and the report on the eurozone balance of payments for December, which showed a balance of 32.6 billion euros against expectations of 34.5 billion. Data on the laying of new homes in the US for January showed a small decrease: 1.57 million against 1.63 million a month earlier, but the issued building permits increased from 1.42 million to 1.56 million, showing the highest figure since January 2007. Published minutes from the last FOMC Fed meeting showed nothing interesting.
On the daily chart, the signal line of the Marlin Oscillator is pointing upward, it is possible to continue the correction to the Fibonacci level of 161.8% at the price of 1.0840. The main objectives of declining 1.0745 and 1.0650/80 are maintained.
On the four-hour chart, the double convergence according to Marlin retains its potential effect, which may result in continued price growth, but the signal line of the oscillator stopped at the boundary with the territory of growth. Its withdrawal under its own support (the turquoise line) neutralizes the influence of convergence. This will happen if the price goes below yesterday's low.
Analysis are provided by InstaForex
-
24-02-20, 11:22 #1183
Senior Member
Just starting here
- Join Date
- Jul 2013
- Age
- 41
- Posts
- 112
- Rep Power
- 0
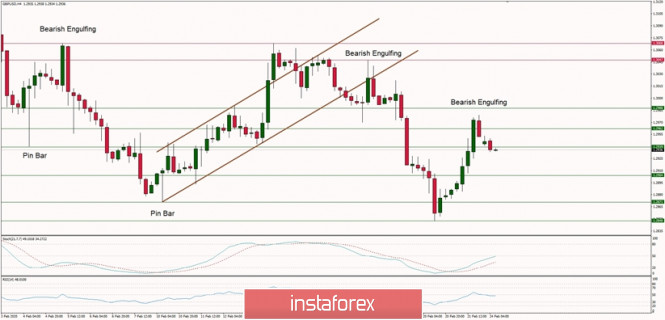
Technical analysis of GBP/USD for 24/02/2020
Technical Market Outlook:
The GBP/USD pair rallied through all the near technical resistance levels located at 1.2871, 1.2904, 1.2939 and 1.2962, but eventually, bulls did not make it through the technical resistance located at the level of 1.2988. The market had made a Bearish Engulfing candlestick pattern around this level and the bears took control over the market. Currently, the price is coming off the hight and traders around the level of 1.2939. The larger timeframe trend remains up, but the recent breakout from the consolidation zone is a signal, that the uptrend might be reversed soon.
Weekly Pivot Points:
WR3 - 1.3255
WR2 - 1.3152
WR1 - 1.3043
Weekly Pivot - 1.2942
WS1 - 1.2840
WS2 - 1.2740
WS3 - 1.2640
Trading recommendations:
The best strategy for current market conditions is to trade with the larger timeframe trend, which is up, so all downward market moves will be treated as local corrections in the uptrend. In order to reverse the trend from up to down in the longer term, the key level for bulls is seen at 1.2756 and it must be clearly violated. The key long-term technical support is seen at the level of 1.2231 - 1.2224 and the key long-term technical resistance is located at the level of 1.3512.
*The market analysis posted here is meant to increase your awareness, but not to give instructions to make a trade.
-
27-02-20, 07:25 #1184
Veteran Member
Just starting here
- Join Date
- Jun 2013
- Age
- 40
- Posts
- 4,044
- Rep Power
- 0
Forecast for EUR/USD on February 27, 2020
EUR/USD
The euro once again tried to compete with the resistance of the Fibonacci level of 138.2% (1.0898) on Wednesday, the trading volume was high, it is very likely that investors again accumulated short positions. The signal line of the Marlin oscillator reached the boundary of the growth territory. The degree of probability of a reversal from this boundary will be considered on a smaller scale chart.
At H4, the oscillator signal line exited down from the wedge and returned to it. In general, this is still a signal for a price reversal. Confirmation of a reversal will be when the price leaves yesterday's low of 1.0855. The immediate goal of the euro 1.0813 is to support the MACD line. Next, we expect the euro at a quote of 1.0745 - at the Fibonacci level of 200.0% (daily).
But the euro is still growing. The growth limit may be the Fibonacci level of 123.6% at the price of 1.0933.
*The market analysis posted here is meant to increase your awareness, but not to give instructions to make a trade.
Analysis are provided by InstaForex
-
28-02-20, 06:14 #1185
Veteran Member
Just starting here
- Join Date
- Jun 2013
- Age
- 40
- Posts
- 4,044
- Rep Power
- 0
Forecast for EUR/USD on February 28, 2020
EUR/USD
The euro showed an abnormal growth of 120 points on Thursday amid moderate (canadian dollar) or even indistinct (Australian dollar) development in other leading currencies.. The reason for this was the widespread risk aversion and the curtailment of European carry trade transactions. The US stock market (S&P 500) fell 4.42%, in one week the decline blocked the previous four-month growth. The market likelihood (in accordance with futures on federal funds) of the Fed's rate cut in March in one day increased from 44.3% to 97.4%, even for April, another cut is 73.1% compared to 27.5% the day before. At a time when the epidemic of the coronavirus began to subside, a storm came to the markets. On the other hand, this is the best time to blow out market bubbles and remove small players from the market. Major players left the market last year. Euro trading volumes were the highest yesterday in the last 5.5 months. The lion's share did not fall on purchases, but on closing stop losses above 1.09. The euro corrected 50% of the entire decline on December 31-March 20. Now you can turn down. The fact is that if investors really consider the collapse to be the beginning of a new global crisis, whether they want it or not, the world will buy dollars even when rates are lowered, but carry trade deals, according to experience, are closed very quickly.
The euro reached a low of January 2020 and the resistance of the embedded line of the price channel on the daily chart. Growth was stopped by the red indicator line of balance, which from a purely technical point of view indicates that the downward mood will continue. The MACD line is also higher than the price. The Marlin has risen, but shows an intention to turn down.
The situation is completely upward on the four-hour chart. The Marlin oscillator in the overbought zone. Taking into account yesterday's volumes, we can expect some price delay in the area of the reached high, investors will need several days to make new decisions. A signal for the resumption of sales will be when the price leaves the under the MACD line, approximately, around 1.0890-1.0900, that is, from the place where there were recent stop losses.
Analysis are provided by InstaForex
-
03-03-20, 06:39 #1186
Veteran Member
Just starting here
- Join Date
- Jun 2013
- Age
- 40
- Posts
- 4,044
- Rep Power
- 0
Forecast for GBP/USD on March 3, 2020
GBP/USD
The quote of the British pound remained at the Fibonacci level of 123.6% for two days. Investors are waiting for news from the negotiations of the British delegation with European politicians. The current stage of negotiations will end on Thursday. Consolidating the price under yesterday's low opens the target at the Fibonacci level of 138.2% at the price of 1.2670. The second target is 161.8% at 1.2530. It is also possible to continue trading in the range, then the price can once again be marked at the Fibonacci level of 110.0% (1.2844).
On the four-hour chart, the signal line of the Marlin oscillator is moving up, which may be a warning of another local increase before the medium-term decrease (potential, expected). Here, the resistance is the MACD line, which moves to the Fibonacci level of 110.0%. The Marlin oscillator by this time will reach the boundary with the growth territory and will turn down from it.
*The market analysis posted here is meant to increase your awareness, but not to give instructions to make a trade.
Analysis are provided by InstaForex
-
04-03-20, 06:35 #1187
Veteran Member
Just starting here
- Join Date
- Jun 2013
- Age
- 40
- Posts
- 4,044
- Rep Power
- 0
Forecast for GBP/USD on March 4, 2020
GBP/USD
Yesterday, the growth of the British pound was stopped at the Fibonacci level of 110.0% (1.2843). At the moment, technical indicators do not show any proactive signals of continued growth or a price reversal. The same situation of uncertainty in the political sphere, the results of trade talks between the UK and the EU should become known tomorrow.
On the four-hour chart, the signal line of the Marlin oscillator touched the boundary with the growth territory. There may be a downward turn from this line, but there may be continued growth.
In general, the situation is going down on both scales - the price is lower than the indicator lines, there are no warning reversal patterns. The pound may rise after the price overcomes the Fibonacci level of 110.0% (1.2904), a return to decline is likely after leaving the level of 123.6% at the price of 1.2760. We are waiting for news from Brussels where trade negotiations take place.
Analysis are provided by InstaForex
-
05-03-20, 06:40 #1188
Veteran Member
Just starting here
- Join Date
- Jun 2013
- Age
- 40
- Posts
- 4,044
- Rep Power
- 0
Forecast for EUR/USD on March 5, 2020
EUR/USD
The EUR/USD quote continues to stay at the Fibonacci level of 76.4% on the daily scale chart, in the area of Monday's close. Trading volumes were high, indicating closing positions from purchases since February 21. The euro is unfolding.
The first goal 1.1035 is to support the MACD line on a daily chart. The second target, 1.0990, is an embedded price channel line, overcoming of which, in turn, opens the way to a medium-term decline in the euro. Investors are laying a 90% chance that the ECB will lower the deposit rate from the current -0.50% to -0.60% at its meeting on March 12th.
*The market analysis posted here is meant to increase your awareness, but not to give instructions to make a trade.
Analysis are provided by InstaForex
-
10-03-20, 07:28 #1189
Veteran Member
Just starting here
- Join Date
- Jun 2013
- Age
- 40
- Posts
- 4,044
- Rep Power
- 0
Forecast for EUR/USD on March 10, 2020
EUR/USD
In the last three weeks of growth, the euro corrected 38.2% of the fall from February 2018 to February 2020. Today, in the Asian session, the euro's fall is more than 70 points, which shows the clear intention of the price to close the gap on Monday. Next, we are waiting for the testing of the Fibonacci level at the price of 1.1200, which coincides with the top on December 13 (marked with a tick).
Fixing the price below this level will direct the price to the support of the MACD line (1.1085). Fixing the price below it will confirm the market's intention to continue selling euros.
As seen on the four-hour chart, the signal line of the Marlin oscillator went down sharply. This is a sign of the market's intention to move down. The support for the MACD line at 1.1200 coincides with the 23.6% Fibonacci level on the higher-scale chart. Accordingly, the level is strong and requires increased care. *The market analysis posted here is meant to increase your awareness, but not to give instructions to make a trade.
Analysis are provided by InstaForex
-
11-03-20, 05:56 #1190
Veteran Member
Just starting here
- Join Date
- Jun 2013
- Age
- 40
- Posts
- 4,044
- Rep Power
- 0
How is coronavirus spreading around the planet? The US, Italy, Spain, China and Iran are at high risk
The Chinese pneumonia virus COVID-2019 has "captured" more than 100 countries around the world. More than 105,000 people are infected, mostly in China. The largest number of infected and deaths is in the "hotbed" of infection - China. Apart from China, Italy has been the most affected at the moment, with more than 6,000 cases of infection. More than 200 people were killed. The entire country is under quarantine. Schools and cinemas have been closed, all sporting events have been canceled, and any events where a large number of people may gather are prohibited. Some regions with the highest number of cases are quarantined. Citizens are not allowed to leave their homes without good reason. According to the current plan, such measures have been taken until April 3. No one knows what will happen after April 3. Everything will depend on whether it is possible to stop the spread of infection in the country. The Italian authorities decided to involve an additional 20,000 doctors and nurses in the fight against the virus. The main thing now is to stop the infection. It is noted that about 600 people are in intensive care, but about 600 have fully recovered. The average age of those who died from the virus is 81 years. It follows that first of all deaths are recorded in the elderly. People with weak, due to age-related reasons, immunity and health. 80% of people who died from the virus had other diseases. Thus, on the example of Italy, we can conclude that the virus is not fatal, but can lead to a fatal outcome if the patient has poor health. Thus, the elderly and people with weak immune systems are primarily at risk.
Meanwhile, panic is brewing in countries with the highest incidence of the disease. Thank God that so far this word only refers to the desire of people to stock up on all necessary products and not to leave the house without unnecessary need. Therefore, a shortage of certain foods may occur. For example, in the UK, Secretary of Health Matt Hancock urged people not to buy more than they needed, assuring that there was enough food for everyone. The minister also assured that he works with supermarkets in the direction of delivering food and necessary goods to the home in case people have to isolate themselves. However, representatives of UK supermarkets argue that the demand for the most necessary food products is "going wild" and cast doubt on the fact that the authorities will be able to keep the situation under control and provide all citizens with food and basic necessities. One of the directors of large supermarket chains even stated that there were no contacts with the government.
Analysis are provided by InstaForex
-
13-03-20, 01:59 #1191
Veteran Member
Just starting here
- Join Date
- Jun 2013
- Age
- 40
- Posts
- 4,044
- Rep Power
- 0
EURUSD reaches key Fibonacci level and bounces
EURUSD was expected to pull back towards the key Fibonacci levels we have mentioned in our previous analysis. EURUSD has reached the 61.8% Fibonacci retracement level and has bounced off of it.
EURUSD has pulled back as a back test of the broken wedge pattern. Price has so far reached the 61.8% level and is bouncing. As we explained in our last Ichimoku cloud analysis, we had a weak sell signal and the first target was the cloud support at 1.1130. Price surpassed our target and reached 1.1060.
So far the back test is successful and supportive of the bullish continuation of the break out. If price pushes back inside the wedge pattern and stays below, then this would be a very bearish sign.
*The market analysis posted here is meant to increase your awareness, but not to give instructions to make a trade.
Analysis are provided by InstaForex
-
18-03-20, 12:03 #1192
Veteran Member
Just starting here
- Join Date
- Jun 2013
- Age
- 40
- Posts
- 4,044
- Rep Power
- 0
Trader's diary for March 18, 2020, Oil fell amid coronavirus outbreak
Oil, as can be seen on the chart, fell to $ 26 for two main reasons, first, OPEC Price War in Russia. Second, the global crisis due to coronavirus which leads to a drop in oil demand.
EURUSD:
The euro is trying to start a new wave of decline against the dollar.
Euro is in a fundamentally bad condition as Europe has become the center of the coronavirus pandemic, and the strongest economies namely Italy, Germany and France are at their most vulnerable state. Due to this, the economy will suffer serious losses.
From an economic point of view, the euro can fall right down to parity with the dollar.
You can keep sales from 1.1053.
*The market analysis posted here is meant to increase your awareness, but not to give instructions to make a trade.
Analysis are provided by InstaForex
-
19-03-20, 07:45 #1193
Veteran Member
Just starting here
- Join Date
- Jun 2013
- Age
- 40
- Posts
- 4,044
- Rep Power
- 0
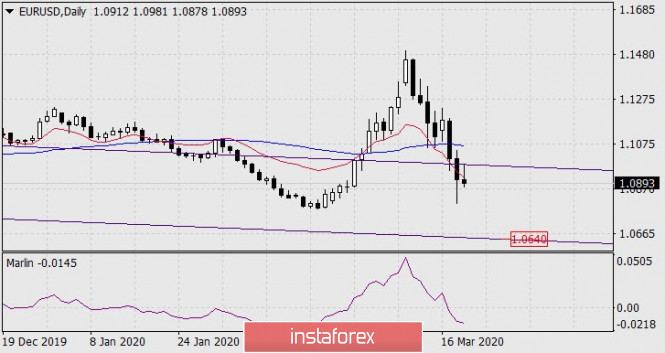
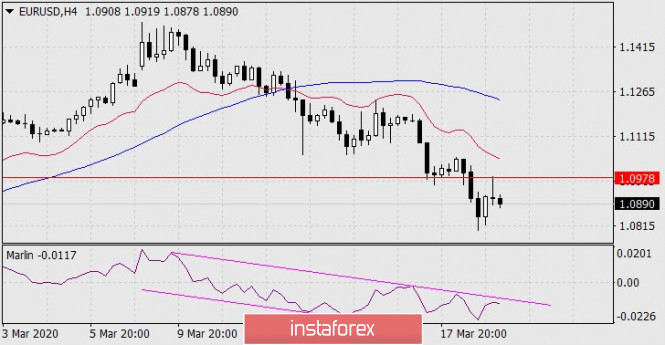
Forecast for EUR/USD on March 19, 2020
EUR/USD
Yesterday, trading in the euro took place in a wide range of about 250 points, this morning the price tested the resistance of the embedded line of the price channel on the daily chart and returned to the red indicator line balance, and opening day occurred under this line, which speaks of the intention of the price to decline further, the market came under the control of the bears. The goal of the decline is the low line of the price channel around 1.0640.
On the four-hour chart, yesterday's convergence on the Marlin oscillator turned out to be broken, although its effect was reflected in more than 80-point growth in the euro. Currently, Marlin is developing in its own downward channel, the lower boundary of which is very, very low.
*The market analysis posted here is meant to increase your awareness, but not to give instructions to make a trade.
Analysis are provided byInstaForex.
-
20-03-20, 07:49 #1194
Veteran Member
Just starting here
- Join Date
- Jun 2013
- Age
- 40
- Posts
- 4,044
- Rep Power
- 0
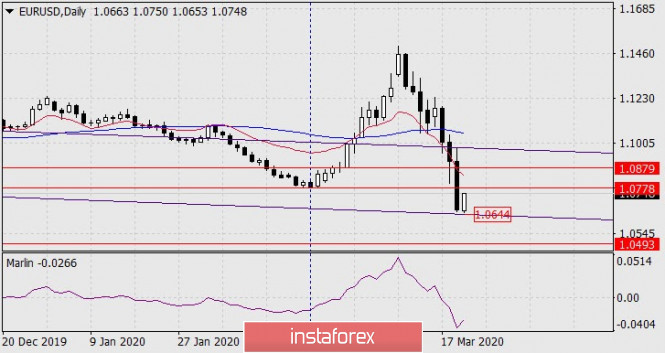
Forecast for EUR/USD on March 20, 2020
EUR/USD
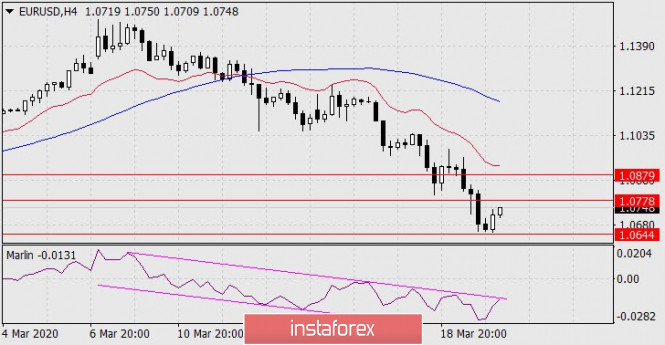
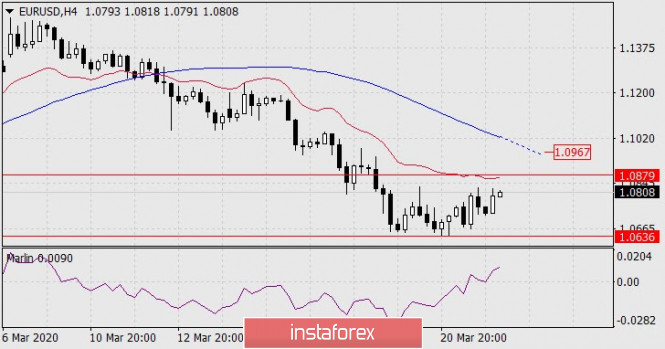
The euro collapsed by 250 points on Thursday, pausing on the embedded line of the price channel of the daily chart. The signal line of the Marlin oscillator slightly turned upwards, which may develop into a short-term price correction, as an option, to the February 20 low at the price of 1.0778. The departure of the quote under the price channel line (1.0644) opens the target at 1.0493 - the February 2017 low. Price taking above 1.0778 will extend the correction to 1.0879 - to the October 1, 2019 low.
The Marlin oscillator also reverses upwards on the four-hour chart, remaining within its own descending channel. We are waiting for the correction to be completed as well as for the euro to fall.
*The market analysis posted here is meant to increase your awareness, but not to give instructions to make a trade.
Analysis are provided byInstaForex.
-
23-03-20, 07:29 #1195
Veteran Member
Just starting here
- Join Date
- Jun 2013
- Age
- 40
- Posts
- 4,044
- Rep Power
- 0
Forecast for EUR/USD on March 23, 2020
EUR/USD
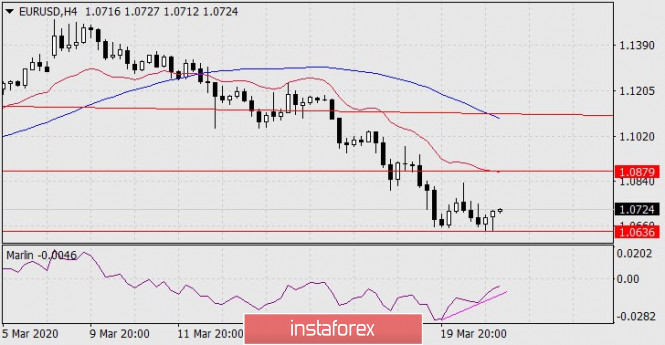
The price was marked on the support line of the embedded price channel in the region of 1.0636 on Thursday, Friday, and today. Finally, the signal line of the Marlin oscillator turned upwards on the daily chart, which creates the prerequisite for corrective growth to the level of 1.0879 - to a low of October 1, 2019. Overcoming the Friday low of 1.0636 opens the target 1.0493 - the low of February 2017.
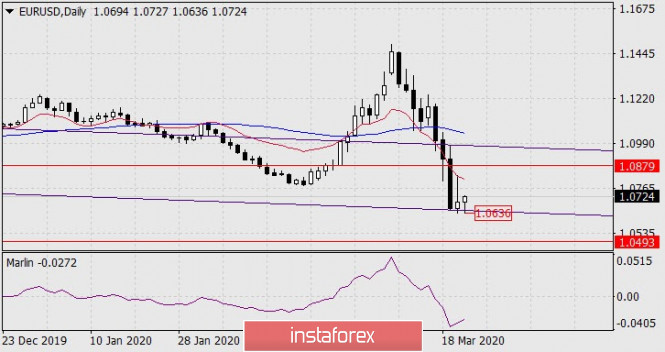
On the four-hour chart, the Marlin oscillator did not form a strong convergence, the signal line has not yet left the zone of negative indicators. The indicator potential may be enough to work out the price of correctional target of 1.0879.
*The market analysis posted here is meant to increase your awareness, but not to give instructions to make a trade.
Analysis are provided byInstaForex.
-
24-03-20, 08:41 #1196
Veteran Member
Just starting here
- Join Date
- Jun 2013
- Age
- 40
- Posts
- 4,044
- Rep Power
- 0
Forecast for EUR/USD on March 24, 2020
EUR/USD
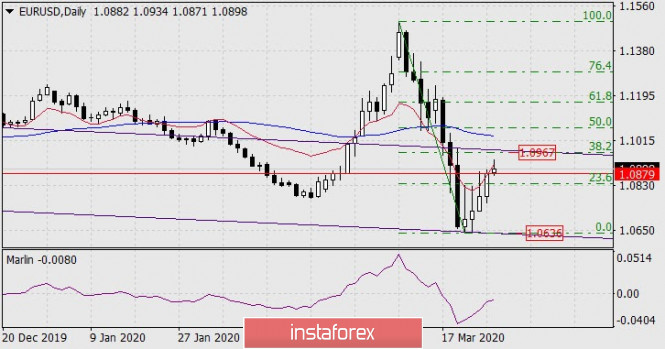
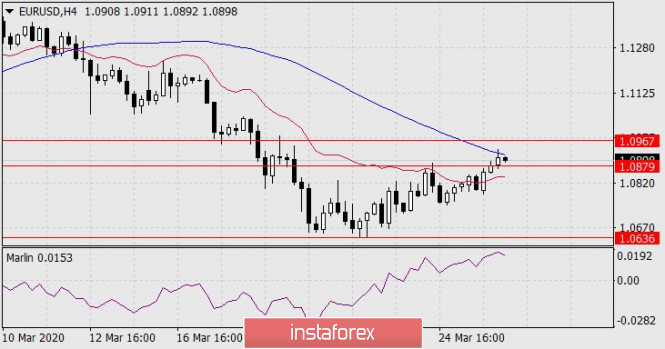
The euro showed a timid correction growth on Monday, but this growth has become confident today in the Asian session. The signal line of the Marlin oscillator continues to gain strength. The first goal of the correction is still the 1.0879 level the October 1, 2019 low, its overcoming opens the second goal of 1.0967 the area where the 38.2% Fibonacci level intersects with the embedded line of the price channel and, possibly, also the MACD line, which is approaching this point. The level is created strong, so now we expect the euro to fall from it with a high probability.
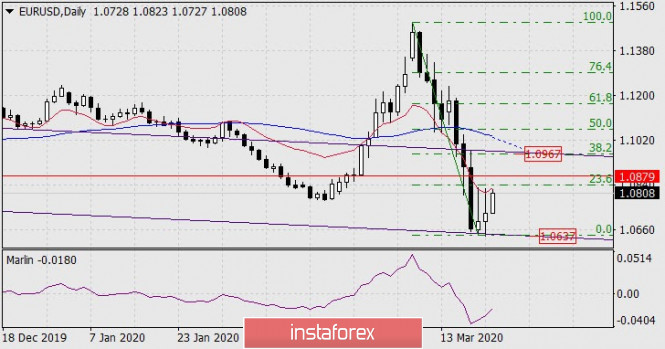
The Marlin oscillator strengthened the growth on the four-hour chart, the signal line was fixed in the zone of positive values the first goal of 1.0879 is likely to be taken, and the pair's quote will continue to grow towards the second goal.
*The market analysis posted here is meant to increase your awareness, but not to give instructions to make a trade.
Analysis are provided byInstaForex.
-
25-03-20, 08:21 #1197
Veteran Member
Just starting here
- Join Date
- Jun 2013
- Age
- 40
- Posts
- 4,044
- Rep Power
- 0
Forecast for AUD/USD on March 25, 2020
AUD/USD
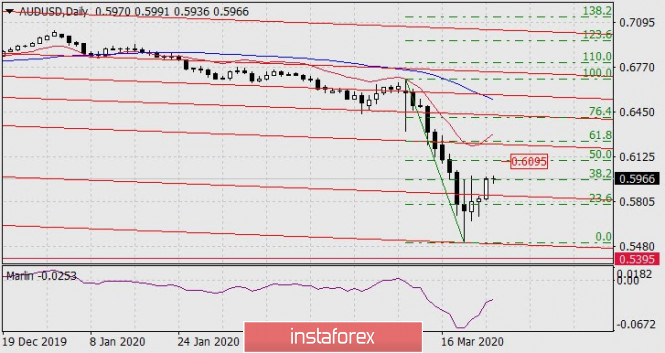
The Australian dollar grew by 145 points on Tuesday, since it worked the correction level of 38.2% of the movement on March 9-19. There are no strong reversal signs, growth to the second correction target by Fibonacci level of 50.0% at the price of 0.6095 is possible.
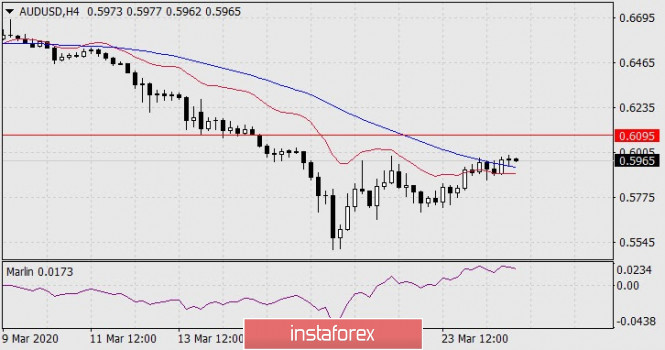
On the four-hour chart, the price has consolidated above the MACD line (blue indicator), which shows the price's intention to continue rising to the next Fibonacci level of 50.0% at the price of 0.6095. The signal line of the Marlin oscillator lies in the lateral direction, which indicates the imminent completion of growth, that is, above 50%, the correction will no longer work.
*The market analysis posted here is meant to increase your awareness, but not to give instructions to make a trade.
Analysis are provided byInstaForex.
-
26-03-20, 08:07 #1198
Veteran Member
Just starting here
- Join Date
- Jun 2013
- Age
- 40
- Posts
- 4,044
- Rep Power
- 0
Forecast for EUR/USD on March 26, 2020
EUR/USD
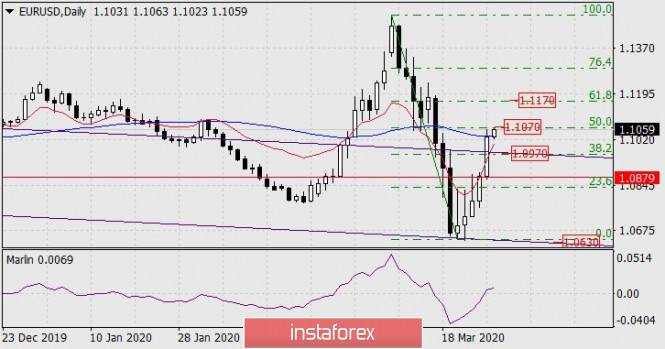
The euro added more than 90 points yesterday and reached the first target level of 1.0879. Today, the euro added another 50 points in the Asian session, clearly slowing down on the resistance of the balance line (red indicator ) of the daily price scale. The next growth target is the point of coincidence of the Fibonacci level of 38.2% with the enclosed line of the price channel in the region of 1.0967. At about the same moment, the signal line of the Marlin oscillator can touch the zero line - the boundary with the growth territory, and turn down.
The price touched the MACD line on the four-hour chart, according to Marlin there is no reversal formation, as a result, the price can make a false exit above the MACD line with working out the target on the daily timeframe, after which we wait for the price to turn down with the target at 1.0636.
*The market analysis posted here is meant to increase your awareness, but not to give instructions to make a trade.
Analysis are provided byInstaForex.
-
27-03-20, 07:27 #1199
Veteran Member
Just starting here
- Join Date
- Jun 2013
- Age
- 40
- Posts
- 4,044
- Rep Power
- 0
Forecast for EUR/USD on March 27, 2020
EUR/USD
The euro climbed 150 points on Thursday due to rising risk appetite amid massive infusion of dollar liquidity by the Federal Reserve worth 75 billion dollars a day, the stock market will grow more than 6% (S&P 500 6.24%) and at the same time on the tragic data on applications for unemployment benefits this past week showed the US economy's opinion in antivirus quarantine, the number of applications reached 3.283 million (!) against the forecast of 1.648 million Before the highest record figure was 669,000 in April 2009. The employment forecast for the next week shows economists' expectations for an increase in unemployment in March from 3.5% to 4.0% and a decrease in non-agricultural employment by 420,000 (in September 2008-422,000). In the euro area, the employment situation is even worse than in the US, but the markets in this situation have traditionally reacted sensitively to the very fact of bad data. Unemployment in Germany for March is expected to rise to 5.1%. We are cautious about the growth of the euro. Also, in the market, investors are taking risks with caution the trading volume was even less than in the previous days of the week.
The correction was already 50% of the fall on March 9-20. The euro's desire to continue its corrective growth to 61.8% will be fraught with even greater difficulties. The Fibonacci level range of 50.0-61.8% contains multiple technical levels that have accumulated since July 2019. The price is currently above the MACD line and the Marlin oscillator has broken into the growth zone, but the market just needs to swing down a little and the indicators will again be in negative values. Consolidating the price above the Fibonacci level of 50.0% (1.1070) will make it possible to continue growth from the Fibonacci level of 61.8% at the price of 1.1170. Moving the price under the 38.2% Fibonacci level, which will also mean breaking through the support of the price channel (1.0970), opening a promising goal of 1.0630 along the lower line of the price channel. The intermediate target level of 1.0879 is the low of October 1, 2019.
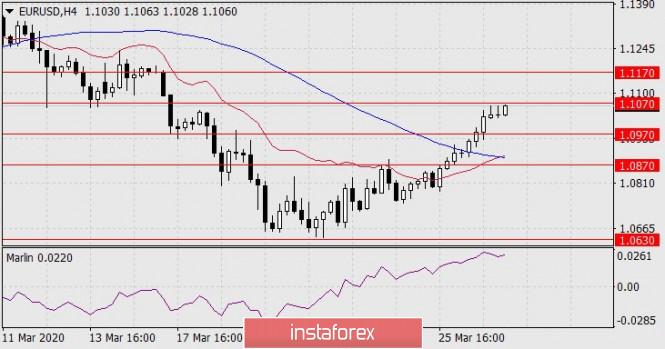
The price is still in a growing position on the four-hour chart, but the leading indicator Marlin is already turning down. We are waiting for the development of events.
*The market analysis posted here is meant to increase your awareness, but not to give instructions to make a trade.
Analysis are provided byInstaForex.
-
30-03-20, 08:57 #1200
Veteran Member
Just starting here
- Join Date
- Jun 2013
- Age
- 40
- Posts
- 4,044
- Rep Power
- 0
Forecast for AUD/USD on March 30, 2020
AUD/USD
The Australian pound grew by 122 points on Friday, with the upper shadow marking the enclosed line of the price channel. Today in the Asian session there is an intention of the price to move down from the achieved resistance. The signal line of the Marlin oscillator also touched the boundary with the growth territory and turns around from it. The purpose of the decline, in the case of a confirmed reversal, becomes the underlying price channel line in the region of 0.5838.
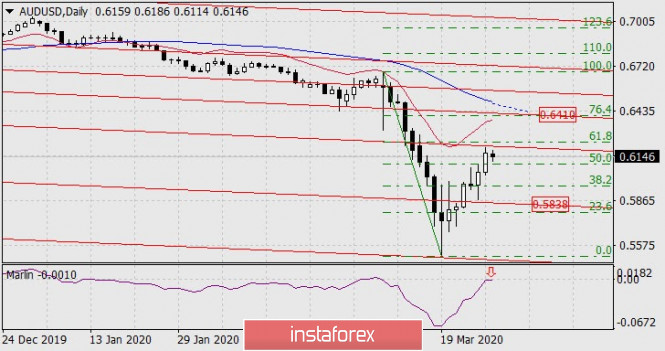
The price exit above Friday's high could extend the aussie's growth to the upper embedded line of the price channel at the intersection with the Fibonacci level of 76.4% at 0.6410. The MACD line also tends to this point.
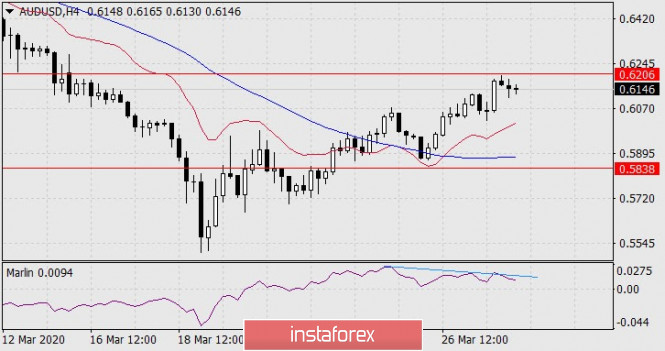
On the four-hour chart according to Marlin, a double divergence has formed, the sign of a reversal has strengthened.
Trading recommendations. It is advisable to open sales directly from current levels with consolidating profit in front of the level of 0.5838, S/L 0.6206. If the price goes above 0.6206, we buy with a target in front of the level of 0.6410, S/L 0.6113.
*The market analysis posted here is meant to increase your awareness, but not to give instructions to make a trade.
Analysis are provided byInstaForex.

 Reply With Quote
Similar Threads
-
Forex News from InstaForex
By InstaForex Gertrude in forum Advertisement PlaceReplies: 2103Last Post: 16-02-24, 10:27 -
Forex Technical & Market Analysis FXCC
By alayoua in forum Advertisement PlaceReplies: 4Last Post: 07-07-16, 00:25 -
Weekly technical analysis for 3 - 7.12, 2012
By bellalca in forum Affiliate program networksReplies: 0Last Post: 04-12-12, 07:09


Bookmarks