
Results 1,121 to 1,140 of 2158
Thread: Instaforex Analysis
Hybrid View
-
21-05-19, 08:53 #1
 Veteran Member
Just starting here
Veteran Member
Just starting here

- Join Date
- Jun 2013
- Age
- 40
- Posts
- 4,044
- Rep Power
- 0

Technical analysis of EUR/USD for 21.05.2019
Technical Market Overview:
After making the local low at the level of 1.1150, the EUR/USD pair has tried to bounce or even rally higher, but this attempt was capped at the technical resistance zone located between the levels of 1.1167 - 1.1173 and the price reversed. The short-term outlook remains bearish and there is no signs or any trend reversal for now. The next target for bears is seen at the level of 1.1111.
Weekly Pivot Points:
WR3 - 1.1317
WR2- 1.1287
WR1 - 1.1208
Weekly Pivot - 1.1178
WS1 - 1.1099
WS2 - 1.1069
WS3 - 1.0986
Trading Recommendations:
The best trading strategy in the current market conditions is to sell the local pull-backs with a tight protective stop loss. Due to the oversold market conditions please pay attention to the candlestick trend reversal patterns and market trend reversal patterns. The next important technical support is located at the level of 1.1111 and this is the next target for bears.
Analysis are provided by InstaForex
-
22-05-19, 10:13 #2
Senior Member
Just starting here
- Join Date
- Jul 2013
- Age
- 41
- Posts
- 112
- Rep Power
- 0
Technical analysis of EUR/USD for 22.05.2019
Technical Market Overview:
The EUR/USD market is still hovering around the technical resistance zone located between the levels of 1.1167 - 1.1174 with no intention of breaking higher so far. There were some attempts to rally but were quickly capped by the bears. The short-term outlook remains bearish and there is no signs or any trend reversal for now. The next target for bears is seen at the level of 1.1135 and 1.1111.
Weekly Pivot Points:
WR3 - 1.1317
WR2- 1.1287
WR1 - 1.1208
Weekly Pivot - 1.1178
WS1 - 1.1099
WS2 - 1.1069
WS3 - 1.0986
Trading Recommendations:
The best trading strategy in the current market conditions is to sell the local pull-backs with a tight protective stop loss. Due to the oversold market conditions please pay attention to the candlestick trend reversal patterns and market trend reversal patterns. The next important technical support is located at the level of 1.1111 and this is the next target for bears.
*The market analysis posted here is meant to increase your awareness, but not to give instructions to make a trade.
-
23-05-19, 07:23 #3
Veteran Member
Just starting here
- Join Date
- Jun 2013
- Age
- 40
- Posts
- 4,044
- Rep Power
- 0
EUR/GBP approaching resistance, potential drop!
Price is approaching our first resistance level.
Entry : 0.8858 Why it's good : 61.8% Fibonacci retracement, channel's resistance
Stop Loss : 0.8956 Why it's good : horizontal overlap resistance, 78.6% Fibonacci retracement
Take Profit : 0.8773
Why it's good :23.6% Fibonacci retracement, horizontal overlap support
Analysis are provided by InstaForex
-
27-05-19, 08:14 #4
Veteran Member
Just starting here
- Join Date
- Jun 2013
- Age
- 40
- Posts
- 4,044
- Rep Power
- 0
EUR/USD approaching resistance, potential drop!
Price is approaching our first resistance level.
Entry : 1.1227
Why it's good : 76.4% Fibonacci retracement, descending resistance line, 61.8% Fibonacci extension
Stop Loss : 1.1266 Why it's good : horizontal swing high resistance
Take Profit : 1.1180
Why it's good : 38.2% Fibonacci retracement, horizontal overlap support
Analysis are provided by InstaForex
-
28-05-19, 08:47 #5
Veteran Member
Just starting here
- Join Date
- Jun 2013
- Age
- 40
- Posts
- 4,044
- Rep Power
- 0
Technical analysis of ETH/USD for 28.05.2019
Crypto Industry News:
One of the largest peer-to-peer cryptocurrencies, LocalBitcoins.com, has banned users living in Iran, according to information published on the company's website.
The source previously informed the financial media in an e-mail that the impulse to limit Iranian transactions was to comply with financial regulations in Finland, where the headquarters of LocalBitcoins.com is located. In addition, the stock exchanges allegedly cut off users from Iran because of sanctions previously imposed on other exchanges by the United States.
Coinbase and Binance cryptocurrency exchanges do not currently support users residing in Iran as well.
Technical Market Overview:
The ETH/USD pair might have completed wave (4) and now the market is unfolding the wave (5) to the upside, but the momentum behind the move up is still low. The target for this wave is seen at the level of $304. For now, the market is consolidating the recent gains in a narrow range between the levels of $278.14 - $263.42 as the market participants wait for the breakout.
Weekly Pivot Points:
WR3 - $321.20
WR2 - $292.77
WR1 - $283.99
Weekly Pivot - $254.33
WS1 - $241.65
WS2 - $213.82
WS3 - $203.55
Trading Recommendations:
The best trading strategy in the current market conditions is to buy the local pull-back as wave 4 is in progress in anticipation of the wave 5 to the upside. Please pay attention to the technical resistance at the level of $278.14 as any breakout above this level is bullish. On the other hand, any violation of the level of $226.17 will accelerate the sell-off towards the next technical support at the level of $212.12.
Analysis are provided by InstaForex
-
29-05-19, 08:56 #6
Veteran Member
Just starting here
- Join Date
- Jun 2013
- Age
- 40
- Posts
- 4,044
- Rep Power
- 0
EUR/GBP approaching resistance, potential drop!
EURGBP approaching resistance, potential drop!
Description :
Price is approaching our first resistance level.
Entry : 0.8852
Why it's good : Horizontal swing high resistance, 61.8% Fibonacci retracement
Stop Loss : 0.8907
Why it's good : 100% Fibonacci extension
Take Profit : 0.8773
Why it's good : 23.6% Fibonacci retracement, horizontal overlap support
Analysis are provided by InstaForex
-
31-05-19, 07:24 #7
Veteran Member
Just starting here
- Join Date
- Jun 2013
- Age
- 40
- Posts
- 4,044
- Rep Power
- 0
GBP/JPY approaching support, big potential bounce coming!!
Price is approaching our first support level.
Entry : 137.65
Why it's good : Horizontal swing low support, 61.8% Fibonacci retracement, 61.8% Fibonacci extension
Stop Loss : 136.29
Why it's good : 100% Fibonacci extension
Take Profit : 139.61
Why it's good : 50% Fibonacci retracement, horizontal overlap resistance, 100% Fibonacci extension
Analysis are provided by InstaForex
-
03-06-19, 07:15 #8
Veteran Member
Just starting here
- Join Date
- Jun 2013
- Age
- 40
- Posts
- 4,044
- Rep Power
- 0
Another failed attempt of the Dollar index capture the 98 price level.
The Dollar index ended last week on a mixed to bearish note as price recaptured the critical resistance at the 98 price level only to lose it with a big decline on the last trading day of the week.
Red rectangle - major resistance
Green rectangle - major support
The Dollar index made new highs on May 23rd but price reversed and did not close above 98. On May 29th and 30th we saw new higher highs but on a closing basis above the major resistance area depicted with a red rectangle. However on the last trading day we saw another reversal. The inability to break above 98 and stay above it, is a worrying sign for bulls. However as long as price is trading above the green rectangle, bulls remain in control of the trend. The many failed attempts point to a bigger reversal in trend, taking into consideration how much time has the index around 98 which is the 61.8% Fibonacci retracement of the entire decline from 103.75 to 88.
Analysis are provided by InstaForex
-
04-06-19, 08:14 #9
Veteran Member
Just starting here
- Join Date
- Jun 2013
- Age
- 40
- Posts
- 4,044
- Rep Power
- 0
Technical analysis of Bitcoin for 04.06.2019
Crypto Industry News:
The Japan House of Representatives officially approved a new bill to amend national laws regulating the cryptographic industry.
The draft law - prepared by the Japanese Financial Services Agency (FSA) and approved by the House in mid-March this year - was adopted by a majority of votes at the plenary session of the Chamber of Councilors, in accordance with the current update of the FSA on the official website.
The project is aimed at introducing changes to two national laws regarding cryptographic assets - the act on the settlement of funds and the law on financial instruments and exchange. Now that the bill has been adopted, the amended acts are expected to enter into force in April 2020.
The proposed changes to Japanese financial instruments and payment services will ostentatiously tighten the regulation of cryptocurrencies to promote user protection, more stringent regulation of trading in cryptographic instruments, mitigate industry risks, such as stock market busts, and the broad establishment of a more transparent legal framework for new asset classes.
According to earlier reports, the bill also introduces a legal change in the name of cryptocurrencies as "cryptographic assets", previously marked in the country as "virtual currencies". The draft also provides for stricter rules regarding trading in margins, limiting the leverage to double and four times the initial deposit.
Technical Market Overview:
The BTC/USD pair has made another wave to the downside as anticipated. This wave is a part of the wave 4 correction and so far reached the level of $7,739 after all the technical supports were violated. The next target for bulls is seen at the level of $7,484. This corrective cycle might evolve into an ABCDE Triangle pattern as well, so please keep an eye on the further developments.
Weekly Pivot Points:
WR3 - $10,284
WR2 - $9,622
WR1 - $9,121
Weekly Pivot - $8.545
WS1 - $8,037
WS2 - $7,438
WS3 - $6,960
Trading Recommendations:
The best strategy in the current market conditions is to trade in the direction of the main trend, which is still up. All the local bounces and correction should be treated as another opportunity to open the buy orders for a better price. Please notice, the larger time frame trend is up and there are no signs of any trend reversal.
Analysis are provided by InstaForex
-
13-06-19, 08:37 #10
Veteran Member
Just starting here
- Join Date
- Jun 2013
- Age
- 40
- Posts
- 4,044
- Rep Power
- 0
GBP/USD near support, a bounce is possible!
GBPUSD is near support, a bounce to 1st resistance is possible
Entry: 1.2844
Why it's good : 100% Fibonacci extension, 38.2% & 23.6% Fibonacci retracement, horizontal swing low support
Stop Loss : 1.1256
Why it's good :38.2% & 61.8% Fibonacci retracement,100% Fibonacci extension, horizontal swing low support
Take Profit : 1.1342
Why it's good: 100% Fibonacci extension, horizontal swing high resistance
Analysis are provided by InstaForex
-
14-06-19, 08:57 #11
Veteran Member
Just starting here
- Join Date
- Jun 2013
- Age
- 40
- Posts
- 4,044
- Rep Power
- 0
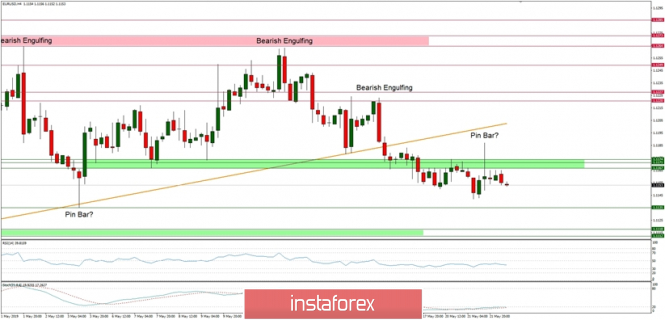
Technical analysis of GBP/USD for 14/06/2019:
Technical Market Overview:
After two Pin Bar like candlestick formation around the upper consolidation boundary, the GBP/USD pair keeps trading close to the support zone located between the levels of 1.2652 - 1.2668. The momentum is barely holding the neutral fifty level and it looks like is about to go lower as well. The stochastic is in the middle of the range now, so all sum up there is no direct signal regarding the future price move now, but the support zone is tempting to be violated. In this scenario, the next target for bears is seen at level 1.2605.
Weekly Pivot Points:
WR3 - 1.2954
WR2 - 1.2856
WR1 - 1.2800
Weekly Pivot Point: 1.2708
WS1 - 1.2658
WS2 - 1.2549
WS3 - 1.1502
Trading Recommendations:
The best strategy in the current market conditions is to trade in the direction of the main trend, which is still down. All the local bounces and correction should be treated as another opportunity to open the sell orders for a better price. Please notice, the larger time frame trend is down and there are no signs of any trend reversal.
Analysis are provided by InstaForex
-
17-06-19, 07:00 #12
Veteran Member
Just starting here
- Join Date
- Jun 2013
- Age
- 40
- Posts
- 4,044
- Rep Power
- 0
USD/CAD approaching resistance, potential reversal!
Price is approaching its resistance where we expect to see a reversal.
Entry : 1.3437
Why it's good : 61.8% Fibonacci retracement, 100% Fibonacci extension, horizontal pullback resistance
Stop Loss : 1.3499
Why it's good : 78.6% Fibonacci retracement
Take Profit : 1.3364
Why it's good : Horizontal pullback support, 38.2% Fibonacci retracement
News are provided by InstaForex
-
18-06-19, 08:00 #13
Veteran Member
Just starting here
- Join Date
- Jun 2013
- Age
- 40
- Posts
- 4,044
- Rep Power
- 0
EUR/GBP near resistance, a drop is possible!
EURGBP is near resistance, a drop to 1st support is possible
Entry: 0.8982
Why it's good : 100% Fibonacci extension, 78.6% Fibonacci retracement, horizontal swing high resistance
Stop Loss : 0.9063
Why it's good :horizontal swing high resistance
Take Profit : 0.8791
Why it's good: 61.8% Fibonacci extension, horizontal overlap support, 61.8% Fibonacci retracement
Analysis are provided by InstaForex
-
19-06-19, 09:05 #14
Veteran Member
Just starting here
- Join Date
- Jun 2013
- Age
- 40
- Posts
- 4,044
- Rep Power
- 0
GBP/USD near resistance, a drop is possible!
GBPUSD is near resistance, a drop to 1st support is possible
Entry: 1.2564
Why it's good : 61.8% Fibonacci extension, 23.6% Fibonacci retracement, horizontal pullback resistance
Stop Loss : 1.2660
Why it's good :horizontal pullback resistance, 61.8% Fibonacci retracement, 61.8% Fibonacci extension
Take Profit : 1.2462
Why it's good: 100% Fibonacci extension
Analysis are provided by InstaForex
-
20-06-19, 07:37 #15
Veteran Member
Just starting here
- Join Date
- Jun 2013
- Age
- 40
- Posts
- 4,044
- Rep Power
- 0
USD/JPY approaching support, possible bounce!
Price is approaching its support where it could potentially bounce up to its resistance at 108.161
Entry : 107.492
Why it's good : 61.8% Fibonacci extension
Take Profit : 108.161
Why it's good : 50% Fibonacci retracement, horizontal pullback resistance, 61.8% Fibonacci extension
Analysis are provided by InstaForex
-
25-06-19, 08:22 #16
Veteran Member
Just starting here
- Join Date
- Jun 2013
- Age
- 40
- Posts
- 4,044
- Rep Power
- 0
Forecast for GBP/USD on June 25, 2019
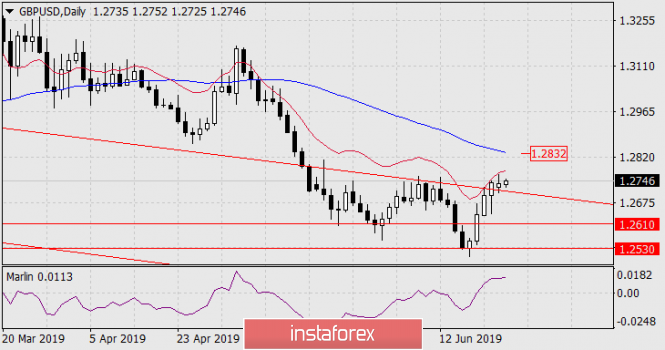
GBP/USD
Yesterday, the pound solved the main task for the possibility of further growth - it consolidated above the line of the price channel on the daily chart. The balance line was on top of a strong resistance. The daily Marlin oscillator signal line lies at the horizon, which makes it possible for the pound to continue its slow growth below the balance line and reach the MACD line (1.2832), presumably at the point where both indicator lines coincide. From this point, a reversal or correction is likely.
There is a weak convergence on the four-hour chart on the Marlin oscillator, but nevertheless it is closer in form to consolidation in the growth zone, which may soon continue to increase the indicator and price.
A signal for a reversal will be the departure of the price below the price channel line on the daily chart and below the MACD line (1.2690) at the four-hour price.
Analysis are provided byInstaForex.
-
26-06-19, 09:03 #17
Veteran Member
Just starting here
- Join Date
- Jun 2013
- Age
- 40
- Posts
- 4,044
- Rep Power
- 0
EUR/GBP approaching resistance, potential drop!
EURGBP is approaching resistance where we might see a drop in price. Entry: 0.8981
Why it's good : Horizontal swing high resistance, 78.6% Fibonacci retracement
Stop Loss : 0.9055
Why it's good : Horizontal swing high resistance
Analysis are provided by InstaForex
-
27-06-19, 02:45 #18
Veteran Member
Just starting here
- Join Date
- Jun 2013
- Age
- 40
- Posts
- 4,044
- Rep Power
- 0
Technical analysis of Gold for June 27
Gold price has pulled back towards $1,400 as expected and noted in our previous posts. The risk reward ratio did not favor bulls and as the RSI was giving bearish divergence signs, we said that we prefer to take profits and stay neutral when price was above $1,430.
Blue lines - bearish divergence
Green line - support trend line
Gold price has pulled back from $1,439 towards $1,400. The bearish divergence warnings by the RSI have been fulfilled. Price has made the minimum required pull back. Price could continue lower towards $1,380-90 area before resuming its up trend. Short-term support is found at $1,410 and resistance at $1.425. Medium-term trend remains bullish. Gold bears will need to break below $1,270-$1,300 area in order to cancel the importance of this bullish breakout.
Analysis are provided by InstaForex
-
03-07-19, 09:20 #19
Veteran Member
Just starting here
- Join Date
- Jun 2013
- Age
- 40
- Posts
- 4,044
- Rep Power
- 0
Technical analysis of GBP/USD for 03/07/2019:
Technical Overview:
The GBP/USD pair has broken below the 61% Fibonacci retracement located at the level of 1.2611 and is heading lower. The next technical support is seen at the level of 1.2559 and 1.2529. The key support is seen at the level of 1.2505 and if this level is violated the downtrend will accelerate. On the other hand, the nearest technical resistance is seen at the level of 1.2605.
Weekly Pivot Points:
WR3 - 1.2870
WR2 - 1.2829
WR1 - 1.2757
Weekly Pivot - 1.2708
WS1 - 1.2629
WS2 - 1.2585
WS1 - 1.2508
Trading Recommendations:
The best strategy for the current market conditions is to buy the corrections in anticipation of the uptrend to resume. This strategy is valid as long as the level of 1.2505 is clearly violated. The larget time frame trend is still down and the recent rally up is the first sign the trend might be reversing. The key long-term technical resistance is seen at the level of 1.2775 and only if this level is violated, there is a chance for the trend reversal.
Analysis are provided by InstaForex
-
04-07-19, 07:12 #20
Veteran Member
Just starting here
- Join Date
- Jun 2013
- Age
- 40
- Posts
- 4,044
- Rep Power
- 0
AUD/USD: commodity market growth and the "hangover" of dollar bulls
The Australian dollar continues to gain momentum: the AUD/USD pair confidently overcame the key mark of 0.7000 and consolidated in the middle of the 70th figure. For two days, the pair shows a nearly recoilless growth, returning lost positions. It is noteworthy that the aussie turned 180 degrees after the July meeting of the RBA, at which the regulator lowered the interest rate and allowed a further easing of monetary policy. Such an abnormal market reaction is primarily associated with the general weakening of the US currency. In addition, the aussie continues to receive support from domestic data and the commodity market - in particular, the cost of iron ore continues to stay above $100 per ton.
In general, the initial optimism of traders was replaced by concern and uncertainty that another attempt to find a compromise will be crowned with success. Similar doubts from investors have background pressure on the US dollar. To one degree or another, this also affects the US currency's postions in dollar pairs. Weak macroeconomic reports in the US only exacerbate the position of the greenback. The slowdown is demonstrated by both key and secondary economic indicators.
Experts have previously warned that the service sector will begin to slow down after the manufacturing sector, and now, apparently, these predictions are beginning to materialize. By the way, the indicator of production orders published today came out at the lowest values since the summer of 2016. The indicator is actively decreasing for the second consecutive month, and the May indicator was revised downward (-1.2% instead of the previous -0.8%). This fundamental picture does not allow the dollar to develop to feel comfortable, even with continued demand. And together with the Australian dollar, the greenback is losing its position at the expense of the aussie's "independent" growth.
Thus, despite the RBA's dovish position, AUD/USD buyers use the market's current situation to their advantage. Uncertain positions of the US currency against the background of a substantial growth in the commodity market makes it possible for the aussie to open new price horizons. The first resistance level is the mark 0.7060 - this is the upper line of the Bollinger Bands indicator on the daily chart. When it is overcome, the Ichimoku trend indicator will form a bullish "Parade of lines" signal, which will open the way for AUD/USD bulls to the next resistance level of 0.7180 (the top line of the Bollinger Bands indicator is already on the weekly chart). Support is the aussie's key for a 0.7000 mark.
Analysis are provided by InstaForex

 Reply With Quote
Similar Threads
-
Forex News from InstaForex
By InstaForex Gertrude in forum Advertisement PlaceReplies: 2103Last Post: 16-02-24, 10:27 -
Forex Technical & Market Analysis FXCC
By alayoua in forum Advertisement PlaceReplies: 4Last Post: 07-07-16, 00:25 -
Weekly technical analysis for 3 - 7.12, 2012
By bellalca in forum Affiliate program networksReplies: 0Last Post: 04-12-12, 07:09


Bookmarks