
Results 961 to 980 of 2158
Thread: Instaforex Analysis
Hybrid View
-
06-12-17, 07:26 #1
 Veteran Member
Just starting here
Veteran Member
Just starting here

- Join Date
- Jun 2013
- Age
- 40
- Posts
- 4,044
- Rep Power
- 0

Fundamental Analysis of AUD/USD for December 6, 2017
AUD/USD has been quite corrective recently after a strong bearish pressure pushing the price off the 0.8150 price area. AUD had been quite mixed with the economic reports where negatives are more in quantity than positive reports for which the currency is currently struggling to gain over USD despite the current weak status of USD. Recently AUD Current Account report was published with negative figure of -9.1B from the previous figure of -9.7B though it is less than the previous figure but could not meet the expectation of much less deficit at -8.8B, Retail Sales report was published with an increase to 0.5% from the previous value of 0.1% which was expected to be at 0.3% and in the Rate Statement the Cash Rate of Australia was unchanged as expected at 1.50% which did not quite helped with the gains of AUD but was able to stop the impulsive bearish pressure in the pair. Today, AUD GDP report was published with a worse value of 0.6% decrease from the previous value of 0.9% which was expected to be at 0.7%. The worse economic report did affect the currency quite well which lead to impulsive bearish pressure today. On the USD side today, ADP Non-Farm Employment Change report is going to be published which is expected to decrease to 189k from the previous figure of 235k, Revised Non-Farm Productivity is expected to increase to 3.3% from the previous value of 3.0%, Revised Unit Labor Cost is expected to decrease to 0.2% from the previous value of 0.5% and Crude Oil Inventories is expected to show less deficit at -3.2M from the previous figure of -3.4M. The forecasts are quite mixed in nature where any better than expected economic report is expected to add to the gains of USD against AUD in the coming days. To sum up, AUD has been quite weak in comparison as it could not dominate USD in its weakest period which is expected to lead to further USD gains in the coming days if USD publishes better economic report results in the future.
Now let us look at the technical view, the price is being held by the dynamic level of 20 EMA and it has worked very well as a resistance to keep the price lower. As the price is currently quite near to the support area of 0.7500-50 the bears are expected to push the price towards the support level in the coming days and any bounce or breaks off the area will lead to further directional movement in this pair. As the price remains below the dynamic level of 20 EMA and 0.7650 price area the bearish bias is expected to continue further.
Analysis are provided by InstaForex
-
13-12-17, 07:45 #2
Veteran Member
Just starting here
- Join Date
- Jun 2013
- Age
- 40
- Posts
- 4,044
- Rep Power
- 0
BTC/USD reacting off our selling entry perfectly, remain bearish
Bitcoin has reached our selling area and is reacting off it nicely. We remain bearish looking to sell below 17459 resistance (Fibonacci extension, bearish price action, bearish divergence) for a drop towards at least 14739 support (Fibonacci retracement, horizontal overlap support).
Stochastic (34,5,3) is seeing major resistance below 98% and also displays bearish divergence vs price, signaling that a reversal is impending.
Reason for the trading strategy (fundamentally):
Bitcoin January futures (which are contracts that let investors buy or sell something at a specific price in the future) price are about $17,800 which is rather close to where we forecast major resistance. This is in line with the immediate resistance we're seeing on the technical side so it would be safe to start looking to short Bitcoin for a correction.
Sell below 17459. Stop loss is at 18770. Take profit is at 14739.
*The market analysis posted here is meant to increase your awareness, but not to give instructions to make a trade.
Analysis are provided by InstaForex
-
18-12-17, 07:19 #3
Veteran Member
Just starting here
- Join Date
- Jun 2013
- Age
- 40
- Posts
- 4,044
- Rep Power
- 0
Technical analysis of EUR/USD for Dec 18, 2017
When the European market opens, some Economic Data will be released, such as German Buba Monthly Report, Final Core CPI y/y, Final CPI y/y, and Italian Trade Balance. The US will release the Economic Data, too, such as NAHB Housing Market Index, so, amid the reports, EUR/USD will move in a ... volatility during this day.
TODAY'S TECHNICAL LEVEL:
Breakout BUY Level: 1.1805.
Strong Resistance:1.1798.
Original Resistance: 1.1787.
Inner Sell Area: 1.1776.
Target Inner Area: 1.1748.
Inner Buy Area: 1.1720.
Original Support: 1.1709.
Strong Support: 1.1698.
Breakout SELL Level: 1.1691.
*The market analysis posted here is meant to increase your awareness, but not to give instructions to make a trade.
Analysis are provided by InstaForex
-
19-12-17, 06:34 #4
Veteran Member
Just starting here
- Join Date
- Jun 2013
- Age
- 40
- Posts
- 4,044
- Rep Power
- 0
Elliott wave analysis of EUR/JPY for December 19, 2017
Wave summary:
EUR/JPY is back testing the broken minor support-line, which now acts as resistance. This former support, now resistance, is expected to cap the upside for more downside pressure towards the pivot point at 131.14, which needs to be broken to confirm that wave (D) completed at 134.50 and wave (E) now is developing towards the ideal target seen at 123.43.
Short-term a break below minor support at 132.10 confirms more downside pressure towards 131.14.
R3: 133.89
R2: 133.76
R1: 133.00
Pivot: 132.10
S1: 131.70
S2: 131.14
S3: 130.56
Trading recommendation:
We are short EUR from 133.40 with stop placed at 133.80.
*The market analysis posted here is meant to increase your awareness, but not to give instructions to make a trade.
Analysis are provided by InstaForex
-
20-12-17, 08:30 #5
Veteran Member
Just starting here
- Join Date
- Jun 2013
- Age
- 40
- Posts
- 4,044
- Rep Power
- 0
AUD/JPY reversing nicely below major resistance
The price has started to form a really nice reversal pattern with bearish divergence being formed. We look to sell below major resistance at 86.67 (Multiple Fibonacci retracements, horizontal overlap resistance, bearish divergence) for a push down to at least 84.69 support (Fibonacci extension, horizontal swing low support).
Stochastic (55,3,1) is seeing major resistance below 98% where we expect a corresponding drop from. We're also seeing bearish divergence vs price signaling that a reversal is impending.
Sell below 86.67. Stop loss is at 87.34 Take profit is at 84.69.
*The market analysis posted here is meant to increase your awareness, but not to give instructions to make a trade.
Analysis are provided by InstaForex
-
29-12-17, 06:26 #6
Veteran Member
Just starting here
- Join Date
- Jun 2013
- Age
- 40
- Posts
- 4,044
- Rep Power
- 0
Wave analysis of the EUR / USD currency pair for December 28, 2017
Analysis of wave counting:
In a thin inter-holiday market, the EUR/USD pair was able to add about 60 pp in price and re-tested to the level of the 19th figure in the second half of yesterday. It can be assumed that the currency pair has reached the final stage of the formation of the wave c, in b, in c, in a, in (C). If this is the case, the pair can resume reduction quotes and mark the beginning of a future wave in a, and in (C) after virtually reaching the highest level achieved yesterday or after the growth to the level 1.1920-1.1930.
Objectives for building a downward wave:
1.1736 - 38.2% by Fibonacci
1.1666 - 23.6% Fibonacci retracement
Goals for building an upward wave:
1.1900
1.1918 - 11.4% Fibonacci retracement
General conclusions and trading recommendations:
The construction of the downward trend section continues, as well as the construction of the assumed wave b, in c, in a, in (C). If this assumption is correct, the quote will resume its increase with targets around 19 figures and the mark of 1.1918. Hereinafter, a decline in quotations may resume with the targets located near the calculated marks of 1.1736 and 1.1666, corresponding to 38.2% and 23.6% Fibonacci, and lower.
*The market analysis posted here is meant to increase your awareness, but not to give instructions to make a trade.
Analysis are provided by InstaForex
-
03-01-18, 07:17 #7
Veteran Member
Just starting here
- Join Date
- Jun 2013
- Age
- 40
- Posts
- 4,044
- Rep Power
- 0
Wave analysis of the USD / JPY currency pair. Weekly review
Analysis of wave counting:
At the end of last week, the pair USD / JPY still began to decline, losing about 90 pp and was able to work out the mark of 112.50 in the middle of the Friday session. Thus, it seems that the currency pair has attempted to confirm the transition to the stage of formation taking a rather complex form of the waves c, b, a, (C). If this is the case, then in the process of the development of the wave structure of this wave c, b, a, (C), the currency pair can continue the already identified downward movement in the direction of the levels of the 111th or even 110th figure.
Targets for the downward wave option:
111.01 - 50.0% of Fibonacci
110.14 - 61.8% of Fibonacci
Targets for the upward wave option:
115.43 - 61.8% of Fibonacci
116.32 - 76.4% of Fibonacci
General conclusions and trading recommendations:
The pair USD / JPY continues to build the upward wave (C). Thus, the increase in quotations may continue within the wave c, a, (C) with targets located near the estimated levels of 115.43 and 116.32, which corresponds to 61.8% and 76.4% of Fibonacci (these goals will be reviewed). The assumed wave b, a, (C) can resume its construction, complicating its internal wave structure.
*The market analysis posted here is meant to increase your awareness, but not to give instructions to make a trade.
Analysis are provided by InstaForex
-
16-01-18, 06:58 #8
Veteran Member
Just starting here
- Join Date
- Jun 2013
- Age
- 40
- Posts
- 4,044
- Rep Power
- 0
Elliott wave analysis of EUR/JPY for January 16, 2018
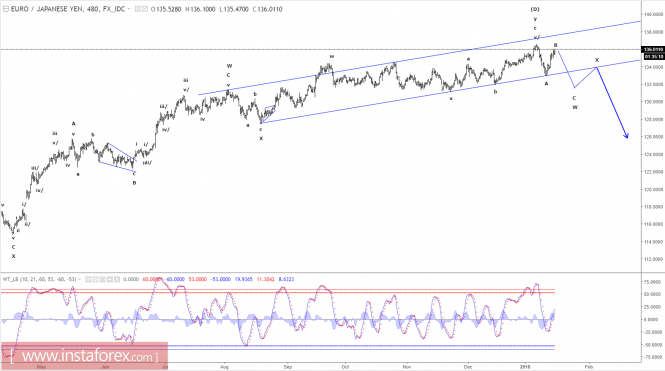
Wave summary:
We continue to regard the rally from 133.01 as corrective and is looking for a break below minor support at 135.36 and more importantly a break below support at 135.00 as confirmation that this correction has completed and a new decline 131.11 is developing.
At no point should a break above 136.64 be seen under this count.
R3: 137.37
R2: 136.64
R1: 136.32
Pivot: 135.36
S1: 135.00
S2: 134.80
S3: 134.35
Trading recommendation:
We are short EUR from 134.75 with our stop placed at 136.75. Upon a break below 135.00 we will lower our stop to 136.15.
Analysis are provided byInstaForex.
-
23-01-18, 08:24 #9
Veteran Member
Just starting here
- Join Date
- Jun 2013
- Age
- 40
- Posts
- 4,044
- Rep Power
- 0
The trading plan for the US session is EUR/USD and GBP/USD
EUR/USD
To open long positions for EURUSD, it is required:
Buyers are trying to get ahold of the level of 1.2252, and while the trade is higher, a chance remains for continued growth of the euro with an update of 1.2294 and the main purpose of a test at 1.2342, where I recommend locking in profits. In the event of a decline below the level of 1.2252 in the afternoon, consider new purchases of the euro after a test at the level of 1.2215, or immediately towards a rebound from 1.2169.
To open short positions for EURUSD, it is required:
A return to the level of 1.2252 would be a good signal to increase short positions on the euro for the purpose of a breakdown and consolidation below the support of 1.2215, which opens a direct road to the area of 1.2169, where I recommend locking in profits. In case the euro further grows, it is possible to look for short positions after the formation of a false breakout at 1.2294 or on a rebound from 1.2342.
GBP/USD
To open long positions for GBP/USD, it is required: Buyers are trying to work out a scenario in the morning in order to consolidate above 1.3886, and while the trade is at this level, you can count on continuing an upward trend with an exit towards a resistance of 1.3940. The main target remains in the area of 1.4018. In the event of a return below the level of 1.3886, I recommend that you pay attention to long positions on the pound only after a test at 1.3839.
To open short positions for GBP/USD, it is required:
The return at 1.3886 will signal an opening of short positions for the pound, which will lead to the renewal of daily lows in the area of 1.3839 and will likely reach a new support level of 1.3797, where I recommend locking in the profit. In case of continued growth in the pound during the afternoon, short positions can be considered for a rebound from 1.3940.
Indicator description
Moving Average (average sliding) 50 days - yellow
Moving Average (average sliding) 30 days - green
MACD: fast EMA 12, slow EMA 26, SMA Bollinger Bands 20
Analysis are provided by InstaForex
-
25-01-18, 07:17 #10
Veteran Member
Just starting here
- Join Date
- Jun 2013
- Age
- 40
- Posts
- 4,044
- Rep Power
- 0
Pound updates annual highs on the background of the report on the labor market
The euro managed to strengthen against the US dollar in the morning against the backdrop of data indicating the likely retention of the euro zone's economic growth rates earlier this year. However, a serious breakthrough in important levels of resistance has not occurred, indicating a restrained demand for risky assets.
According to the IHS Markit report, Germany's economy continues to show good results in early 2018 due to the growth of activity in the services sector. So, the index of supply managers for the German services sector in January 2018 increased to 57.0 points against 55.8 points in December. Economists, on the contrary, expected a decline in the index. The index for the manufacturing sector in January fell slightly, to 61.2 points.
In the eurozone, there are also signs of stable growth, as evidenced by the data.
According to the IHS Markit report, the preliminary composite index of supply managers of the eurozone in January 2018 increased to 58.6 points against 58.1 points in December. It should be noted that the index values above 50 indicate an increase in activity. This growth in the index corresponds to a quarterly growth of the economy by 1%.
In France, the preliminary index of supply managers for the manufacturing sector in January this year dropped to 58.1 points against the December value of 58.8 points. But the preliminary index of supply managers for the services sector, on the contrary, increased in January to 59.3 points against 59.1 points in December. Economists had expected that the service sector index would drop to a level of 58.9 points.
As for the technical picture of the EURUSD pair, there have been no significant changes. The main objective of euro buyers today will be to keep above the 1.2300 area, which will make it possible to count on continuing the upward trend, with the update of the new significant highs of 1.2390 and 1.2430.
The British pound continued its growth against the US dollar, after it became known that the employment rate in the UK from September to November 2017 reached a record high. Meanwhile, wages in the UK declined, which indicates a worsening of the financial situation of consumers after the referendum on Brexit.
According to a report by the National Bureau of Statistics, the employment rate in the UK was 4.3%, which fully coincided with the forecasts of economists. The average earnings in the UK for the period increased by 2.4%, while real wages fell by 0.5%.
Analysis are provided by InstaForex
-
06-02-18, 07:00 #11
Veteran Member
Just starting here
- Join Date
- Jun 2013
- Age
- 40
- Posts
- 4,044
- Rep Power
- 0
Technical analysis of EUR/USD for Feb 06, 2018
When the European market opens, some Economic Data will be released such as Retail PMI, French Gov Budget Balance, and German Factory Orders m/m. The US will release the Economic Data too, such as IBD/TIPP Economic Optimism, JOLTS Job Openings, and Trade Balance, so, amid the reports, EUR/USD will move in a low to medium volatility during this day.
TODAY'S TECHNICAL LEVEL:
Breakout BUY Level: 1.2444.
Strong Resistance:1.2437.
Original Resistance: 1.2425.
Inner Sell Area: 1.2413.
Target Inner Area: 1.2384.
Inner Buy Area: 1.2355.
Original Support: 1.2343.
Strong Support: 1.2331.
Breakout SELL Level: 1.2324.
Analysis are provided by InstaForex
-
06-03-18, 07:35 #12
Veteran Member
Just starting here
- Join Date
- Jun 2013
- Age
- 40
- Posts
- 4,044
- Rep Power
- 0
USD/JPY approaching resistance, prepare to sell
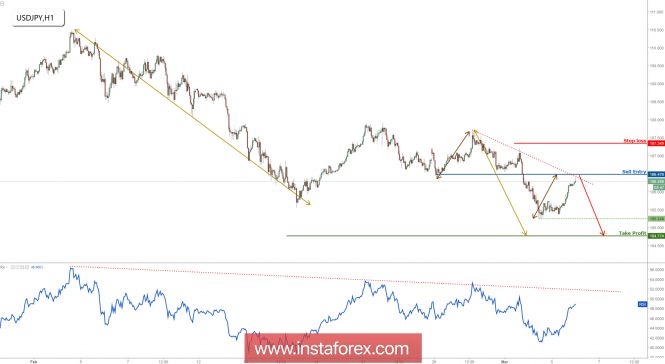
The price is seeing strong resistance at 106.47 (Fibonacci retracement, Fibonacci extension, horizontal overlap resistance, descending resistance) and a strong reaction could occur at this price to push it down to 104.77 support (Fibonacci extension). We do have to watch out for intermediate support at 105.24 (horizontal swing low support) which needs to be broken to open a further drop.
RSI (89) sees descending resistance hold price down really well with its bearish momentum.
Sell below 106.47. Stop loss at 107.34. Take profit at 104.77.
Analysis are provided byInstaForex.
-
22-03-18, 08:31 #13
Veteran Member
Just starting here
- Join Date
- Jun 2013
- Age
- 40
- Posts
- 4,044
- Rep Power
- 0
Technical analysis of NZD/USD for March 22, 2018
NZD/USD is expected to trade with bullish outlook. The pair is still showing upward momentum after a break-out from a resistance level at 0.7185 (now a key support). Currently, it is trading at levels above both the 20-period and 50-period moving averages while targeting the first upside target at 0.7260 (around the high of March 19). The relative strength index is well directed in the 70s, indicating strong upward momentum for the pair. Upon crossing 0.7260, the next upside target at 0.7280 would come into sight.
The black line shows the pivot point. Currently, the price is above the pivot point which is a signal for long positions. If it remains below the pivot point, it will indicate short positions. The red lines show the support levels, while the green line indicates the resistance levels. These levels can be used to enter and exit trades.
Resistance levels: 0.7260, 0.7305, and 0.7350.
Support levels: 0.7150, 0.7125, and 0.7100.
Analysis are provided by InstaForex
-
10-04-18, 06:54 #14
Veteran Member
Just starting here
- Join Date
- Jun 2013
- Age
- 40
- Posts
- 4,044
- Rep Power
- 0
Sensation from North Korea
AUD / USD
On Friday, the Australian dollar did not give rise to the speculative sentiment of the European and American traders and was fundamentally declined by 10 points on the general unfavorable background of foreign markets. Oil lost in price slightly more than 2%, iron ore -0.08%, copper -0.7%.
This morning, investors were satisfied with the growth in the construction sector activity from AIG in the March assessment, the growth came in from 56.0 to 57.2 points. The NAB business confidence index will be release tomorrow, as the March forecast showed results of 12 against 9 in February. Also, the stock markets of the APR failed to grow badly today despite the Friday drop in the US market, with the Nikkei 225 + 0.68%, S & P / ASX 200 + 0.37%, and China A50 + 0.26%. The possible optimism is related to Kim Jong-un's statement about the readiness to test the nuclear weapons and to conduct a denuclearization of the Korean Peninsula. The "Australian" currency could possibly grow in the range of 0.7760 / 75.
* The presented market analysis is informative and does not constitute a guide to the transaction.
*The market analysis posted here is meant to increase your awareness, but not to give instructions to make a trade.
Analysis are provided by InstaForex
-
16-04-18, 08:31 #15
Veteran Member
Just starting here
- Join Date
- Jun 2013
- Age
- 40
- Posts
- 4,044
- Rep Power
- 0
Elliott wave analysis of EUR/NZD for April 16, 2018
EUR/NZD is following the expected path and is correcting. The minimum corrective target at 1.6793 has already been tested, but we expected a little more correction closer to the 1.6835 - 1.6860 area will be seen before lower again towards the ideal target near 1.6620. The test of 1.6620 will ideally complete the corrective decline from 1.7162. That said it's possible that a larger correction is developing and if this is the case, a decline to 1.6220 should be expected before a more firm bottom is in place.
R3: 1.6860
R2: 1.6820
R1: 1.6793
Pivot: 1.6736
S1: 1.6676
S2: 1.6620
S3: 1.6580
Trading recommendation:
We are looking for an EUR-selling opportunity at 1.6845.
*The market analysis posted here is meant to increase your awareness, but not to give instructions to make a trade.
Analysis are provided by InstaForex
-
17-04-18, 08:48 #16
Veteran Member
Just starting here
- Join Date
- Jun 2013
- Age
- 40
- Posts
- 4,044
- Rep Power
- 0
Fundamental Analysis of EUR/USD for April 17, 2018
EUR/USD has been quite impulsive with the bullish gains recently which engulfed the recent bearish pressure with a daily candle yesterday. The volatility in the EURUSD is still quite high and expected to have no definite trend momentum until 1.25 is broken above or 1.21 is broken below. Despite having worse economic reports EUR gained good momentum over USD recently which is expected to push higher in the coming days. Today EUR German ZEW Economic Sentiment report is going to be published which is expected to decrease to -0.8 from the previous positive figure of 5.1, Italian Trade Balance report is expected to show an increase to 2.23B which previously was at -0.09B and ZEW Economic Sentiment report is expected to decrease to 7.3 from the previous figure of 13.4. On the other hand, today USD Building Permits report is going to be published which is expected to increase to 1.33M from the previous figure of 1.30M, Housing Starts is also expected to increase to 1.27M from the previous figure of 1.24M, Capacity Utilization Rate is expected to have slight decrease to 77.9% from the previous value of 78.1% and Industrial Production report is expected to decrease to 0.3% from the previous value of 1.1%. Moreover, today FOMC Member Williams and Quarles is going to speak about the nation's interest rate and monetary policy which is expected to be neutral in nature. As of the current scenario, both currencies in the pair is expected to have mixed economic results today and this week there is no further high impact economic reports or events to push the price into a definite trend but as the EUR is quite stronger in comparison to USD with the market sentiment, further bullish momentum is expected after certain retracement along the way in the coming days.
Now let us look at the technical view. The price is currently residing above 1.2350 which was recently broken below with a daily close showing good evidence of price proceeding lower. As of yesterday, after having a daily close above 1.2350 does signify previous bearish move as a false break which is currently expected to push the price much higher in the coming days with the target towards 1.2450-1.25 price area. As the price remains above 1.2350 area, the further bullish pressure is expected in this pair.
*The market analysis posted here is meant to increase your awareness, but not to give instructions to make a trade.
Analysis are provided by InstaForex
-
19-04-18, 08:29 #17
Veteran Member
Just starting here
- Join Date
- Jun 2013
- Age
- 40
- Posts
- 4,044
- Rep Power
- 0
Technical analysis: Intraday Level For EUR/USD, April 19, 2018
When the European market opens, some Economic Data will be released such as Spanish 10-y Bond Auction and Current Account. The US will release the Economic Data too, such as Natural Gas Storage, CB Leading Index m/m, Unemployment Claims, and Philly Fed Manufacturing Index, so, amid the reports, EUR/USD will move in a low to medium volatility during this day.
TODAY'S TECHNICAL LEVEL:
Breakout BUY Level: 1.2438.
Strong Resistance:1.2431.
Original Resistance: 1.2419.
Inner Sell Area: 1.2407.
Target Inner Area: 1.2378.
Inner Buy Area: 1.2349.
Original Support: 1.2337.
Strong Support: 1.2325.
Breakout SELL Level: 1.2318.
Disclaimer:
Trading Forex (foreign exchange) on margin carries a high level of risk, and may not be suitable for all Traders or Investors. The high degree of leverage can work against you as well as for you. Before deciding to invest in foreign exchange you should carefully consider your investment objectives, level of experience, and risk appetite. The possibility exists that you could sustain a loss of some or all of your initial investment and therefore you should not invest money that you cannot afford to lose. You should be aware of all the risks associated with foreign exchange trading, and seek advice from an independent financial advisor if you have any doubts.
*The market analysis posted here is meant to increase your awareness, but not to give instructions to make a trade.
Analysis are provided by InstaForex
-
23-04-18, 07:51 #18
Veteran Member
Just starting here
- Join Date
- Jun 2013
- Age
- 40
- Posts
- 4,044
- Rep Power
- 0
Technical analysis: Intraday Level For EUR/USD, April 23, 2018
When the European market opens, some Economic Data will be released such as German Buba Monthly Report, Flash Services PMI, Flash Manufacturing PMI, German Flash Services PMI, German Flash Manufacturing PMI, French Flash Services PMI, and French Flash Manufacturing PMI. The US will release the Economic Data too, such as Existing Home Sales, Flash Services PMI, and Flash Manufacturing PMI, so, amid the reports, EUR/USD will move in a low to medium volatility during this day.
TODAY'S TECHNICAL LEVEL:
Breakout BUY Level: 1.2333.
Strong Resistance:1.2326.
Original Resistance: 1.2314.
Inner Sell Area: 1.2302.
Target Inner Area: 1.2273.
Inner Buy Area: 1.2244.
Original Support: 1.2232.
Strong Support: 1.2220.
Breakout SELL Level: 1.2213.
*The market analysis posted here is meant to increase your awareness, but not to give instructions to make a trade.
Analysis are provided by InstaForex
-
02-05-18, 08:00 #19
Veteran Member
Just starting here
- Join Date
- Jun 2013
- Age
- 40
- Posts
- 4,044
- Rep Power
- 0
Technical analysis: Intraday Level For EUR/USD, May 02, 2018
When the European market opens, some Economic Data will be released such as Unemployment Rate, Italian Prelim GDP q/q, Prelim Flash GDP q/q, Italian Monthly Unemployment Rate, Final Manufacturing PMI, Final Manufacturing PMI, French Final Manufacturing PMI, Italian Manufacturing PMI, and Spanish Manufacturing PMI. The US will release the Economic Data too, such as Federal Funds Rate, Crude Oil Inventories, and ADP Non-Farm Employment Change, so, amid the reports, EUR/USD will move in a medium to high volatility during this day.
TODAY'S TECHNICAL LEVEL:
Breakout BUY Level: 1.2050.
Strong Resistance:1.2043.
Original Resistance: 1.2031.
Inner Sell Area: 1.2019.
Target Inner Area: 1.1991.
Inner Buy Area: 1.1963.
Original Support: 1.1951.
Strong Support: 1.1939.
Breakout SELL Level: 1.1932.
Analysis are provided by InstaForex
-
09-05-18, 05:49 #20
Veteran Member
Just starting here
- Join Date
- Jun 2013
- Age
- 40
- Posts
- 4,044
- Rep Power
- 0
Pound and the euro continue to fall
Despite good industrial production figures in Germany for March of this year, the European currency continued its decline against the US dollar and a number of other world currencies on Tuesday morning. The speech of the chairman of the Fed was taken by traders with a certain optimism. Although, Powell did not touch on the conditions of monetary policy but instead spoke more about its impact on other developed economies of the world.
According to the report of the Federal Bureau of Statistics of Germany, industrial production in March 2018 grew by 1.0% compared with February, while economists expected an increase of 0.8%. As stated in the report, the main reason for the growth was the increase in production of capital goods. Compared with March 2017, industrial production in Germany increased by 3.2%.
Good data from Germany, after the disastrous beginning of the year, instilled some optimism in investors, but, as we see on the EURUSD chart, this is not enough.
The morning speech by the Chairman of the Federal Reserve, Jerome Powell, had a positive effect on the quotes of the US dollar. Powell said that despite the Fed's repeated increase in rates since December 2015, financial conditions in the US have become less stringent, while monetary stimulus has had only a relatively limited impact on the flow of capital in emerging economies in recent years. He also noted that the Fed, as much as possible, clearly intends to talk about the prospects of politics in order to avoid unrest in the markets.
As for the technical picture of the EURUSD pair, the downtrend persists and so far there are no prerequisites for a reversal. The breakdown at the support level of 1.1890 opens up new prospects for updating the lows in the areas of 1.1830 and 1.1790. The main goal now will be the level of the minimum of December 12, 2017 which is the level of 1.1717.
The British pound grew reluctantly but returned to the lower boundary of the side channel, which also indicates the continued downward trend in the trading instrument. Pressure on the pound in the first half of the day could be formed by statements of British Foreign Secretary Boris Johnson. During the interview, Johnson expressed his dissatisfaction with the plan of the customs agreement, which was proposed by Prime Minister Theresa May and which should enter into force after Brexit.
According to the minister, the variant of the customs agreement contradicts everything that the UK aspired to by agreeing to Brexit and leaving the EU, since the preservation of import duties in favor of the EU will retain control over trade policy and laws.
Analysis are provided by InstaForex

 Reply With Quote
Similar Threads
-
Forex News from InstaForex
By InstaForex Gertrude in forum Advertisement PlaceReplies: 2103Last Post: 16-02-24, 10:27 -
Forex Technical & Market Analysis FXCC
By alayoua in forum Advertisement PlaceReplies: 4Last Post: 07-07-16, 00:25 -
Weekly technical analysis for 3 - 7.12, 2012
By bellalca in forum Affiliate program networksReplies: 0Last Post: 04-12-12, 07:09


Bookmarks