
Results 941 to 960 of 2158
Thread: Instaforex Analysis
-
26-06-18, 08:14 #941
 Veteran Member
Just starting here
Veteran Member
Just starting here

- Join Date
- Jun 2013
- Age
- 40
- Posts
- 4,044
- Rep Power
- 0

Trading Plan for Crude Oil for June 26, 2018
Technical outlook:
A medium-term time frame has been presented (4 hours) here, and the most probable wave counts have been labelled here. It looks to be like a bearish resumption trade setup is getting ready in Crude Oil now. Let us understand the wave counts from sub 73.00 levels. The drop from 73.00 to almost 63.50 has been an impulse (unfolding into 5 waves) as labeled here. The entire drop can be labeled as wave (1). The subsequent rally then unfolded into a probable Zigzag (5-3-5) corrective wave structure, labeled as a-b-c here. Also note that the termination of the wave (2) is just at Fibonacci 0.618 resistance, around 69.50 levels, which triggered a sharp reversal yesterday. if this ave structure holds to be good, we should witness a continued drop lower towards 58.00 and 48.00 respectively. Ideally, prices should now stay below 73.00 levels going forward.
Trading plan:
Remain short now, stop above 73.00, target 58.00 at least.
Fundamental outlook:
Watch out for US Consumer confidence numbers to be out today at 10:00 AM EST.
Analysis are provided by InstaForex
-
27-06-18, 11:26 #942
Senior Member
Just starting here
- Join Date
- Jul 2013
- Age
- 41
- Posts
- 112
- Rep Power
- 0
Technical analysis on Gold for June 27, 2018
Gold price remains in a bearish trend. Price is approaching important weekly support levels and at least a short-term bounce is approaching. Gold price has weekly oversold signals, warning not to be bearish at current levels. We have no reversal confirmation yet, but we believe that soon we will see the reversal. The key level is at $1,268.
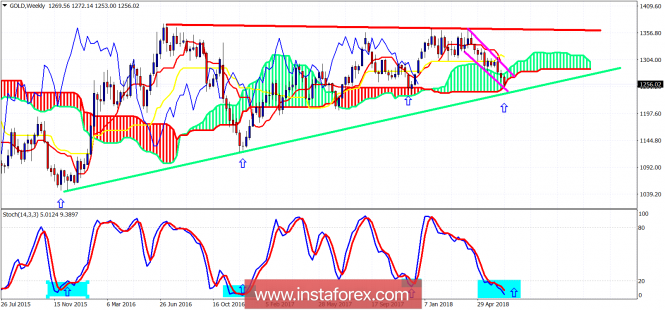
Green line - long-term support
Red line - long-term resistance
Blue arrows - reversal points when Stochastic was oversold.
Gold price is challenging the weekly cloud support and the weekly upward sloping trend line. All the previous times the stochastic was so oversold, Gold rallied. Our time frame is for the next 1-2 months and therefore our risk tolerance should be similar to the downside. Our target remains new highs above $1,400.
*The market analysis posted here is meant to increase your awareness, but not to give instructions to make a trade.
-
28-06-18, 10:39 #943
Senior Member
Just starting here
- Join Date
- Jul 2013
- Age
- 41
- Posts
- 112
- Rep Power
- 0
Technical analysis of USD/CAD for June 28, 2018
Overview:
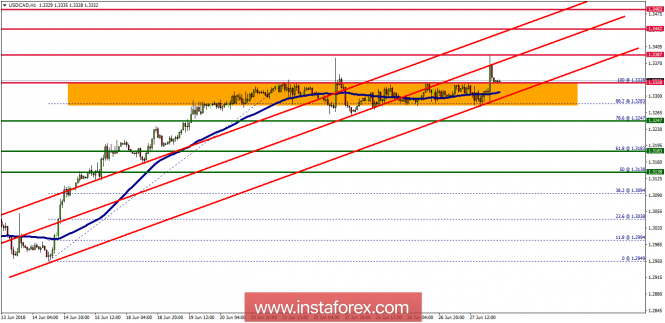
The USD/CAD pair broke the resistance that turned into strong support at the level of 1.3247 since days. The level of 1.3247 coincides with the ratio of 78.6% Fibonacci which is expected to act as a major support on the H1 chart today. Consequently, the first support is set at the level of 1.3247. Moreover, the RSI starts signaling an upward trend, and the trend is still showing strength above the moving average (100). Hence, the market is indicating a bullish opportunity above the area of 1.3247/1.3300. So, the market is likely to show signs of a bullish trend around 1.3247 - 1.3300. In other words, buy orders are recommended above the ratio of 78.6% Fibonacci (1.3247) with the first target at the level of 1.3387 in order to test the first resistance in the same time frame. If the pair succeeds to pass through the level of 1.3387, the market will probably continue towards the next objective at 1.3442. The daily strong support is seen at 1.3247. Thus, if a breakout happens at the support level of 1.3243, then this scenario may be invalidated.
*The market analysis posted here is meant to increase your awareness, but not to give instructions to make a trade.
-
29-06-18, 10:14 #944
Senior Member
Just starting here
- Join Date
- Jul 2013
- Age
- 41
- Posts
- 112
- Rep Power
- 0
Technical analysis of USD/CHF for June 29, 2018
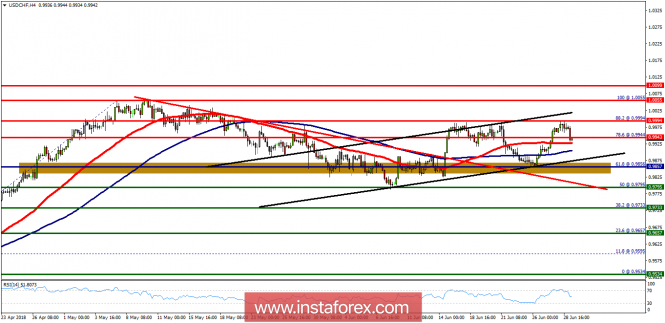
The USD/CHF pair faced resistance at the level of 0.9943. The strong resistance has been already formed at the level of 0.9943 and the pair is likely to try to approach it in order to test it again. However, if the pair fails to pass through the level of 0.9943, the market will indicate a bearish opportunity below the new strong resistance level of 0.9943 (the level of 0.9943 coincides with a ratio of 78.6% Fibonacci). Moreover, the RSI starts signaling a downward trend, as the trend is still showing strength above the moving average (100) and (50). Thus, the market is indicating a bearish opportunity below 0.9943, so it would be good to sell at 0.9940 with the first target of 0.9795. It will also call for a downtrend in order to continue towards 0.9733. The daily strong support is seen at 0.9733. On the other hand, the stop loss order should always be taken into account, for that it will be reasonable to set your stop loss at the level of 1.0055 (the double top on the H4 chart).
*The market analysis posted here is meant to increase your awareness, but not to give instructions to make a trade.
-
03-07-18, 08:44 #945
Senior Member
Just starting here
- Join Date
- Jul 2013
- Age
- 41
- Posts
- 112
- Rep Power
- 0
Technical analysis of Gold for July 03, 2018
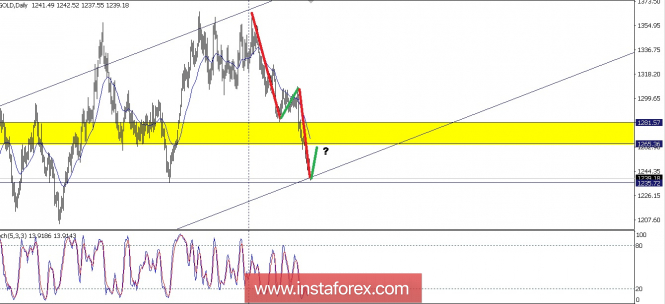
From the Daily Charts we know the Gold bias is still in a Bullish Condition, this can be seen by the Gold still moving in an up Channel event. Now Gold has a correction and tries to test the nearest Support level at 1,235.72 but it seems that in a few days Gold will be back to its previous bias (Bull). This is already confirmed by the Stochastic Oscilator now at the Oversold level and preparr to go up above the 20 level, so the next few days ahead it seems the Gold will go back to the previous bias (Bull). (Dsiclaimer)
*The market analysis posted here is meant to increase your awareness, but not to give instructions to make a trade.
-
04-07-18, 07:50 #946
Veteran Member
Just starting here
- Join Date
- Jun 2013
- Age
- 40
- Posts
- 4,044
- Rep Power
- 0
Technical analysis of AUD/USD for July 04, 2018
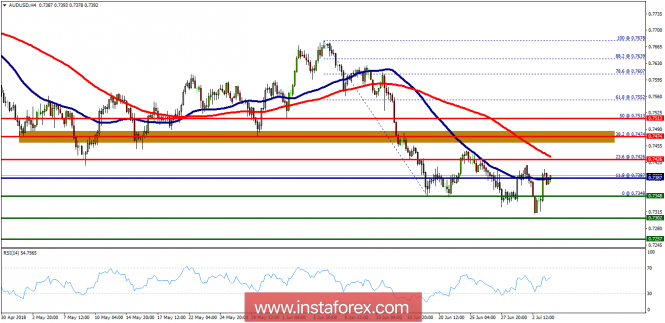
Overview:
Last week, the AUD/USD pair fell from the level of 0.7474 towards 0.7348. Now, the price is set at 0.7371. The resistance is seen at the levels of 0.7426 and 0.7474. Moreover, the price area of 0.7474 remains a significant resistance zone. Therefore, there is a possibility that the AUD/USD pair will move downside and the structure of a fall does not look corrective. The trend is still below the 100 EMA for that the bearish outlook remains the same as long as the 100 EMA is headed to the downside. Thus, amid the previous events, the price is still moving between the levels of 0.7426 and 0.7257. If the AUD/USD pair fails to break through the resistance level of 0.7426, the market will decline further to 0.7474 as the first target. This would suggest the bearish market because the RSI indicator is still in a negative spot and does not show any trend-reversal signs. The pair is expected to drop lower towards at least 0.7302 so as to test the daily support 2. On the other hand, if a breakout takes place at the resistance level of 0.7474, then this scenario may become invalidated.
Analysis are provided byInstaForex.
-
05-07-18, 07:46 #947
Veteran Member
Just starting here
- Join Date
- Jun 2013
- Age
- 40
- Posts
- 4,044
- Rep Power
- 0
Technical analysis: Intraday Level For EUR/USD, July 05, 2018
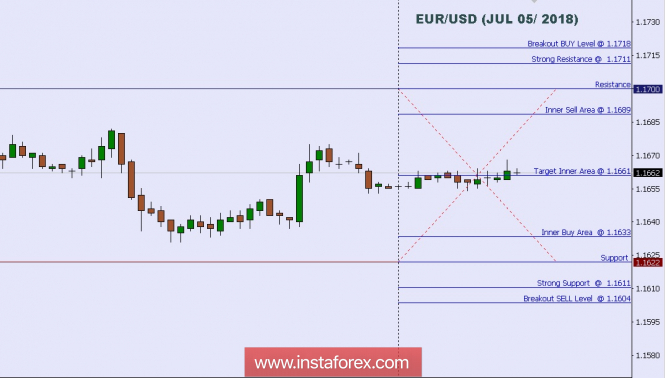
When the European market opens, some Economic Data will be released such as French 10-y Bond Auction, Spanish 10-y Bond Auction, Retail PMI, and German Factory Orders m/m. The US will release the Economic Data too, such as Crude Oil Inventories, ISM Non-Manufacturing PMI, Final Services PMI, Unemployment Claims, ADP Non-Farm Employment Change, and Challenger Job Cuts y/y, so, amid the reports, EUR/USD will move in a medium to high volatility during this day.
TODAY'S TECHNICAL LEVEL:
Breakout BUY Level: 1.1718.
Strong Resistance:1.1711.
Original Resistance: 1.1700.
Inner Sell Area: 1.1689.
Target Inner Area: 1.1661.
Inner Buy Area: 1.1633.
Original Support: 1.1622.
Strong Support: 1.1611.
Breakout SELL Level: 1.1604.
Analysis are provided byInstaForex.
-
06-07-18, 07:30 #948
Veteran Member
Just starting here
- Join Date
- Jun 2013
- Age
- 40
- Posts
- 4,044
- Rep Power
- 0
Technical analysis of NZD/USD for July 06, 2018
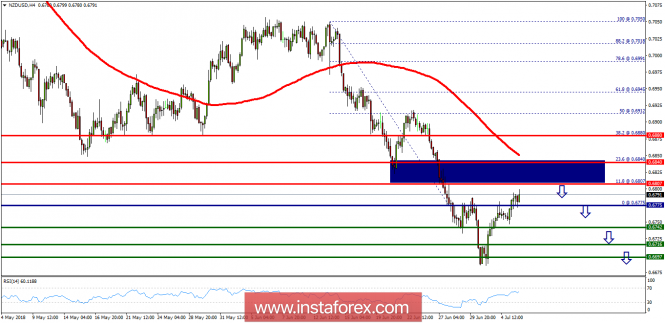
The NZD/USD (kiwi) pair continues to move downwards from the level of 0.6840. This week, the pair dropped from the level of 0.6840 to trade around the 0.6775 level. This level of 0.6840 coincides with the major resistance today. Today, the first resistance level is seen at 0.6840 followed by 0.6880, while daily support 1 is found at 0.6742. Also, the level of 0.6775 represents a key price today for that it is acting as major resistance/support this week. Amid the previous events, the pair is still in a downtrend, because the NZD/USD pair is trading in a bearish trend from the new resistance line of 0.6840/0.6807 towards the first support level at 0.6742 in order to test it. If the pair succeeds to pass through the level of 0.6742, the market will indicate a bearish opportunity below the level of 0.6742. Then, resell again at the price of 0.6742 with the targets of 0.6716 and 0.6697. On the other hand, if a breakout happens at the resistance level of 0.6840, then this scenario may be invalidated.
Analysis are provided byInstaForex.
-
10-07-18, 08:18 #949
Veteran Member
Just starting here
- Join Date
- Jun 2013
- Age
- 40
- Posts
- 4,044
- Rep Power
- 0
Wave analysis of EUR / USD. The euro continues to adhere to the working scenario
Analysis of wave counting:
During the trades on Friday, the currency pair EUR / USD added about 50 percentage points, remaining thus in the stage of construction of the proposed wave 3, c, 4. If this is the case, then the quotes will continue to rise with targets near the mark of 1.1856, which corresponds to 100.0% of Fibonacci, and higher. The wave c can assume a pronounced 5-wave structure, which allows one to assume the growth of the pair to area 20 of the figure. The construction of wave 5 of the downward trend section is being postponed for an indefinite period.
The objectives for the option with sales: 1.1440 - 323.6% of the Fibonacci of the highest order
1,1118 - 423.6% of Fibonacci
The objectives for the option with purchases:
1.1866 - 100.0% of Fibonacci
1.2072 - 127.2% of Fibonacci
General conclusions and trading recommendations:
The pair EUR / USD continues to rise within wave 3, c, 4. Thus, on July 9 I recommend to remain in purchases with targets located near the calculated marks of 1.1856 and 1.2072, which corresponds to 100.0% and 127.2% of Fibonacci. Return to sales, I recommend after receiving confirmation of the completion of the entire wave 4. At the moment there is no sign of the completion of the construction of this wave.
Analysis are provided by InstaForex
-
12-07-18, 09:25 #950
Veteran Member
Just starting here
- Join Date
- Jun 2013
- Age
- 40
- Posts
- 4,044
- Rep Power
- 0
Trading Plan for EUR/USD for July 12, 2018
Technical outlook:
The hourly EUR/USD chart presented here indicates that the currency pair is dropping in a corrective manner since printing highs at the 1.1790 levels recently. At this point in time, prices are finding support at a past resistance turned support zone around the 1.1660/70 levels. According to the Fibonacci extensions displayed here, it remains quite possible for the pair to drop through the 1.1650/30 levels to find further support before turning higher. The price support is seen at the 1.1590 levels, followed by the 1.1530 levels, respectively, while interim resistance is seen at the 1.1790 levels. Most probable direction is to push higher at least one last time towards 1.1850 and above, before reversing lower again. Please note that in the medium term, till the prices remain below the 1.2150 levels, bears shall be in complete control.
Trade plan:
Aggressive traders, now look to buy again between the 1.1630/60 levels, with stop below 1.1550 and target above 1.1850.
Fundamental outlook:
Watch out for USD CPI at 0800 AM EST today.
Analysis are provided by InstaForex
-
13-07-18, 09:03 #951
Veteran Member
Just starting here
- Join Date
- Jun 2013
- Age
- 40
- Posts
- 4,044
- Rep Power
- 0
Technical analysis of NZD/USD for July 13, 2018
Overview: The NZD/USD pair continues to move downwards from the level of 0.6840 (23.6% of Fibonacci retracement). This week (from 9 to 13 July 2018), the pair has dropped from the level of 0.6840 to trade around the 0.6775 level. This level of 0.6840 coincides with the major resistance today. Today, the first resistance level is seen at 0.6840 followed by 0.6880, while daily support 1 is found at 0.6742. Also, the level of 0.6775 represents a key price today for that it is acting as major resistance/support this week. Amid the previous events, the pair is still in a downtrend, because the NZD/USD pair is trading in a bearish trend from the new resistance line of 0.6840/0.6807 towards the first support level at 0.6742 in order to test it. If the pair succeeds to pass through the level of 0.6742, the market will indicate a bearish opportunity below the level of 0.6742. Then, resell again at the price of 0.6742 with the targets of 0.6716 and 0.6697. On the other hand, if a breakout happens at the resistance level of 0.6843, then this scenario may be invalidated.
Analysis are provided by InstaForex
-
16-07-18, 09:01 #952
Veteran Member
Just starting here
- Join Date
- Jun 2013
- Age
- 40
- Posts
- 4,044
- Rep Power
- 0
Technical analysis of Bitcoin For July 16, 2018
The Bitcoin at the 4-hour charts looks clearly moving in a Bearish bias. This can be confirmed by the price still moving in a down slope channel and the Exponential Moving Average period 21 still bellow the Linear Weighted Moving Average period 55, as long as the price does not break out and close above the 6,360.51, it is highly likely the bias from this cryptocurrency will still be in a Bearish condition.
Analysis are provided by InstaForex
-
17-07-18, 08:39 #953
Veteran Member
Just starting here
- Join Date
- Jun 2013
- Age
- 40
- Posts
- 4,044
- Rep Power
- 0
Technical analysis: Intraday Level For EUR/USD, July 17, 2018
When the European market opens, there's no Economic Data will be released from the Euro Zone, but The US will release the Economic Data such as TIC Long-Term Purchases, NAHB Housing Market Index, Industrial Production m/m, and Capacity Utilization Rate, so, amid the reports, EUR/USD will move in a low to medium volatility during this day.
TODAY'S TECHNICAL LEVEL:
Breakout BUY Level: 1.1767.
Strong Resistance:1.1760.
Original Resistance: 1.1749.
Inner Sell Area: 1.1738.
Target Inner Area: 1.1710.
Inner Buy Area: 1.1682.
Original Support: 1.1671.
Strong Support: 1.1660.
Breakout SELL Level: 1.1653.
Analysis are provided by InstaForex
-
18-07-18, 09:09 #954
Veteran Member
Just starting here
- Join Date
- Jun 2013
- Age
- 40
- Posts
- 4,044
- Rep Power
- 0
Technical analysis: Intraday level for USD/JPY, July 18, 2018
In Asia, Japan today will not release any Economic Data, but the US will release some Economic Data such as Beige Book, Crude Oil Inventories, Housing Starts, and Building Permits. So, there is a probability the USD/JPY will move with a low to medium volatility during this day.
TODAY'S TECHNICAL LEVEL:
Resistance. 3: 113.54.
Resistance. 2: 113.32.
Resistance. 1: 113.10.
Support. 1: 112.82.
Support. 2: 112.60.
Support. 3: 112.38.
Analysis are provided by InstaForex
-
19-07-18, 08:36 #955
Veteran Member
Just starting here
- Join Date
- Jun 2013
- Age
- 40
- Posts
- 4,044
- Rep Power
- 0
Technical analysis: Intraday Level For EUR/USD, July 19, 2018
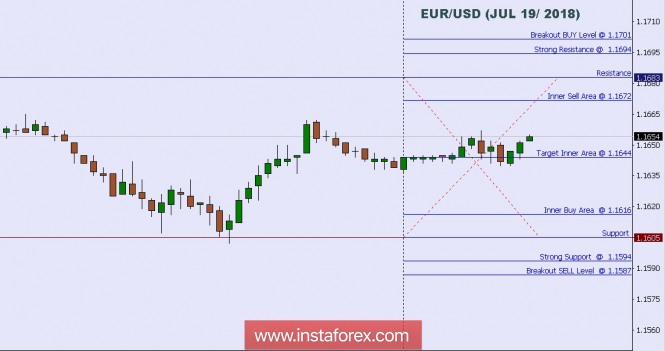
When the European market opens, some Economic Data will be released such as Spanish 10-y Bond Auction. The US will release the Economic Data too, such as Natural Gas Storage, CB Leading Index m/m, Unemployment Claims, and Philly Fed Manufacturing Index, so, amid the reports, EUR/USD will move in a low to medium volatility during this day.
TODAY'S TECHNICAL LEVEL:
Breakout BUY Level: 1.1701.
Strong Resistance:1.1694.
Original Resistance: 1.1683.
Inner Sell Area: 1.1672.
Target Inner Area: 1.1644.
Inner Buy Area: 1.1616.
Original Support: 1.1605.
Strong Support: 1.1594.
Breakout SELL Level: 1.1587.
Analysis are provided byInstaForex.
-
20-07-18, 08:52 #956
Veteran Member
Just starting here
- Join Date
- Jun 2013
- Age
- 40
- Posts
- 4,044
- Rep Power
- 0
Technical analysis: Intraday Level For EUR/USD, July 20, 2018
When the European market opens, some Economic Data will be released such as Current Account and German PPI m/m. The US today will not release any Economic Data, so, amid the reports, EUR/USD will move in a low to medium volatility during this day.
TODAY'S TECHNICAL LEVEL:
Breakout BUY Level: 1.1711.
Strong Resistance:1.1704.
Original Resistance: 1.1693.
Inner Sell Area: 1.1682.
Target Inner Area: 1.1654.
Inner Buy Area: 1.1625.
Analysis are provided by InstaForex
-
24-07-18, 09:10 #957
Veteran Member
Just starting here
- Join Date
- Jun 2013
- Age
- 40
- Posts
- 4,044
- Rep Power
- 0
Elliott wave analysis of EUR/NZD for July 24, 2018
We continue to look for more upside pressure through resistance at 1.7268 and more importantly through resistance at 1.7305, that calls for red wave iii towards 1.7505 on the way higher towards 1.8381.
Support is now seen at 1.7206 and again at 1.7170. Ideally the later will be able to protect the downside for the expected break above 1.7268.
R3: 1.7305
R2: 1.7268
R1: 1.7232
Pivot: 1.7208
S1: 1.7184
S2: 1.7164
S3: 1.7144
Trading recommendation:
We are long EUR at 1.7226 with our stop placed at 1.7110. If you are not long EUR yet, then buy EUR upon a break above 1.7268 and start by using the same stop at 1.7110.
*The market analysis posted here is meant to increase your awareness, but not to give instructions to make a trade.
Analysis are provided by InstaForex
-
26-07-18, 09:05 #958
Veteran Member
Just starting here
- Join Date
- Jun 2013
- Age
- 40
- Posts
- 4,044
- Rep Power
- 0
Elliott wave analysis of EUR/NZD for July 26, 2018
The ongoing correction in red wave ii keeps pushing lower, but it must not break below the start of red wave i at 1.7116 as a break below here, will confirm that black wave ii still is in motion and is headed for support at 1.7066. If, however, the low of red wave i at 1.7116 stays untouched, as we expected, for a break above the channel resistance near 1.7199, that will call for red wave iii towards 1.7510 on the way towards the first long-term target at 1.8381.
R3: 1.7305
R2: 1.7268
R1: 1.7199
Pivot: 1.7184
S1: 1.7165
S2: 1.7130
S3: 1.7116
Trading recommendation: We are long EUR from 1.7226 with our stop placed at 1.7110. If you are not long EUR yet, then buy a break above the channel-resistance at 1.7199 and use the same stop at 1.7110.
Analysis are provided by InstaForex
-
27-07-18, 08:45 #959
Veteran Member
Just starting here
- Join Date
- Jun 2013
- Age
- 40
- Posts
- 4,044
- Rep Power
- 0
Elliott wave analysis of EUR/NZD for July 27, 2018
EUR/NZD is a break above the descending channel resistance-line near 1.7173 indicating that red wave ii completed with the test of 1.7130 and red wave iii towards 1.7510 now is developing.
Short-term, we would like to see a break above resistance at 1.7207 too, as confirmation that red wave iii is in motion for the next impulsive rally.
Support is now seen at 1.7162 and again at 1.7130. Ideally the later will be able to protect the downside for the expected break above 1.7207.
R3: 1.7305
R2: 1.7268
R1: 1.7207
Pivot: 1.7184
S1: 1.7162 S2: 1.7130
S3: 1.7116
Trading recommendation:
We are long EUR from 1.7226 with our stop placed at 1.7110. If you are not long EUR yet, you should buy here at 1.7180 or upon a break above 1.7207 and use the same stop at 1.7110.
Analysis are provided by InstaForex
-
30-07-18, 09:16 #960
Veteran Member
Just starting here
- Join Date
- Jun 2013
- Age
- 40
- Posts
- 4,044
- Rep Power
- 0
Elliott wave analysis of EUR/NZD for July 30, 2018
We continue to expect support at 1.1716 will be able to protect the downside for a break above resistance at 1.7207 that confirms, that red wave ii has completed and that red wave iii towards 1.7510 and above is developing.
An unexpected break below support at 1.7116 will tell us that the correction in black wave ii/ still is in motion for a continuation closer to 1.7067 before a possible corrective low should be in place.
R3: 1.7268
R2: 1.7207
R1: 1.7163
Pivot: 1.7137
S1: 1.7116
S2: 1.7067
S3: 1.7033
Trading recommendation:
We are long EUR from 1.7226, with our stop placed at 1.7110. If you are not long EUR, the buy a break above 1.7207 and use the same stop at 1.7110.
Analysis are provided by InstaForex

 Reply With Quote
Similar Threads
-
Forex News from InstaForex
By InstaForex Gertrude in forum Advertisement PlaceReplies: 2103Last Post: 16-02-24, 10:27 -
Forex Technical & Market Analysis FXCC
By alayoua in forum Advertisement PlaceReplies: 4Last Post: 07-07-16, 00:25 -
Weekly technical analysis for 3 - 7.12, 2012
By bellalca in forum Affiliate program networksReplies: 0Last Post: 04-12-12, 07:09


Bookmarks