
Results 881 to 900 of 2158
Thread: Instaforex Analysis
Threaded View
-
05-02-18, 07:01 #11
 Veteran Member
Just starting here
Veteran Member
Just starting here

- Join Date
- Jun 2013
- Age
- 40
- Posts
- 4,044
- Rep Power
- 0

Daily analysis of GBP/USD for February 05, 2018
The pair is struggling to consolidate the price action above the resistance level of 1.4280 and it seems that the 200 SMA could act, once again, as a dynamic support. If that happens, GBP/USD could resume the overall bullish bias and can skyrocket towards the 1.4393 level. MACD indicator remains in the negative territory, calling for a leg lower.
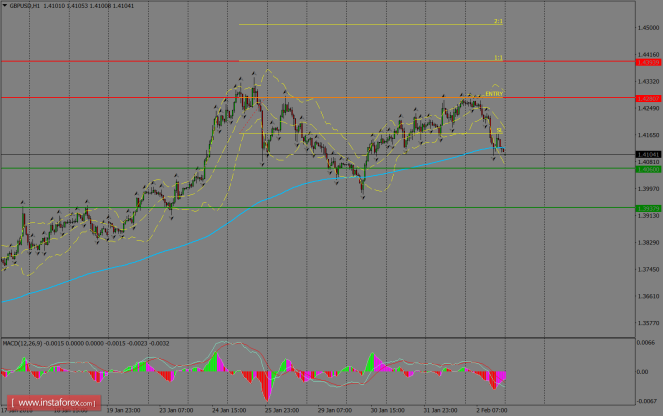
H1 chart's resistance levels: 1.4280 / 1.4393
H1 chart's support levels: 1.4060 / 1.3937
Trading recommendations for today:
Based on the H1 chart, buy (long) orders only if the GBP/USD pair breaks a bullish candlestick; the resistance level is at 1.4280, take profit is at 1.4393 and stop loss is at 1.4168.
Analysis are provided byInstaForex.

 Reply With Quote
Similar Threads
-
Forex News from InstaForex
By InstaForex Gertrude in forum Advertisement PlaceReplies: 2103Last Post: 16-02-24, 10:27 -
Forex Technical & Market Analysis FXCC
By alayoua in forum Advertisement PlaceReplies: 4Last Post: 07-07-16, 00:25 -
Weekly technical analysis for 3 - 7.12, 2012
By bellalca in forum Affiliate program networksReplies: 0Last Post: 04-12-12, 07:09


Bookmarks