
Results 761 to 780 of 2158
Thread: Instaforex Analysis
Threaded View
-
10-05-17, 11:47 #11
 Senior Member
Just starting here
Senior Member
Just starting here

- Join Date
- Jul 2013
- Age
- 41
- Posts
- 112
- Rep Power
- 0

Ichimoku indicator analysis of Gold for May 10, 2017
Gold price continues to make lower lows and lower highs. Trend remains bearish. Gold has limited downside. I still prefer bullish positions at the current levels.
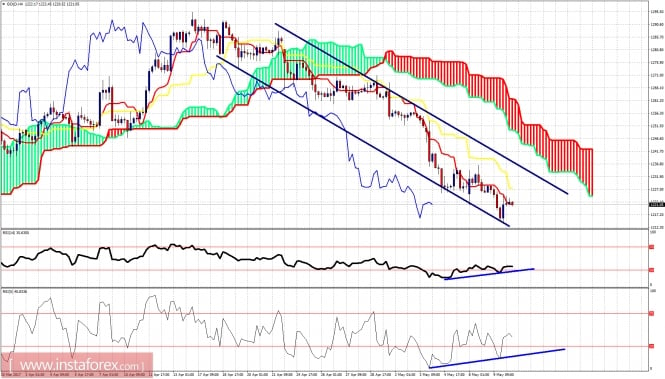
Blue lines - bearish channel
Despite being still inside the bearish channel and below both the tenkan- and kijun-sen, the RSI divergence signals that gold is just above previous lows at $1,194. I believe there are a lot of chances for a move higher at least towards the Kumo resistance at $1,250.
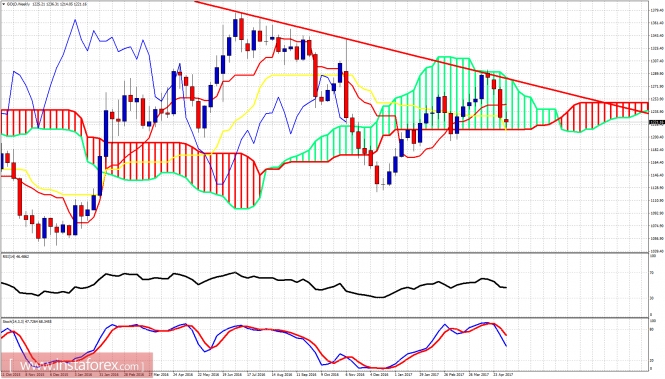
Red line -long-term resistance trend line
Gold price remains inside the weekly cloud but above the weekly kijun-sen. Price has held above the lower Kumo boundary and this is a positive sign. If Gold manages to make a higher low relative to the $1,194 low in March, we could expect a strong upward reversal start from around current levels.
InstaForex analytical reviews will make you fully aware of market trends!
Being an InstaForex client, you are provided with a large number of free services for efficient trading.
More analysis - at instaforex.com

 Reply With Quote
Similar Threads
-
Forex News from InstaForex
By InstaForex Gertrude in forum Advertisement PlaceReplies: 2103Last Post: 16-02-24, 10:27 -
Forex Technical & Market Analysis FXCC
By alayoua in forum Advertisement PlaceReplies: 4Last Post: 07-07-16, 00:25 -
Weekly technical analysis for 3 - 7.12, 2012
By bellalca in forum Affiliate program networksReplies: 0Last Post: 04-12-12, 07:09


Bookmarks