
Results 441 to 460 of 2158
Thread: Instaforex Analysis
Hybrid View
-
16-08-21, 14:17 #1
 Senior Member
Just starting here
Senior Member
Just starting here

- Join Date
- Jul 2013
- Age
- 41
- Posts
- 112
- Rep Power
- 0

Technical Analysis of ETH/USD for August 16, 2021

Crypto Industry News:
Christopher Perkins will become the new President and Managing Partner of CoinFund.
The information is important because it shows how strongly the blockchain industry and the cryptocurrency market have developed. Until a few years ago, it was hard to imagine a situation where a high-ranking employee in the financial sector (Perkins was one of Citigroup's CEOs) would quit everything to work in the cryptocurrency industry. Hiring a new CoinFund president is expected to positively affect the company's reputation.
CoinFund CEO on hiring Christopher Perkins
According to CoinFund founder and CEO Jake Brukhman, this is not only a milestone for the company, but an announcement of a trend in which Wall Street will start to pay attention to the possibilities of blockchain technology:
"Chris joining CoinFund is not only a major milestone for our firm, but is also indicative of a broader trend as Wall Street turns its attention to the opportunities within the blockchain-technology space".
Technical Market Outlook:
The ETh/USD pair has been seen rallying during the weekend. The bounce from the level of $3,122 was strong and bulls tested the recent high seen at the level of $3,330. Nevertheless, the bulls were not strong enough to close the daily candle above the level of $3,330, so it might be a time for another pull-back during the up trend. The immediate techncial support is seen at the level of $3,185 and $3,122.
Weekly Pivot Points:
WR3 - $3,888
WR2 - $3,615
WR1 - $3,448
Weekly Pivot - $3,162
WS1 - $3,024
WS2 - $2,746
WS3 - $2,578
Trading Outlook:
Ethereum have started the next wave up and violated the long-term target at the level of $3,000. The next long-term target for ETH is seen at the level of $4,394. Nevertheless, in order to continue the long-term up trend, the price can not break below the technical support at the level of $2,695. The level of $1,728 (61% Fibonacci retracement of the last big impulsive wave up) is still the key long-term technical support for bulls.
*The market analysis posted here is meant to increase your awareness, but not to give instructions to make a trade.
-
28-10-21, 09:19 #2
Senior Member
Just starting here
- Join Date
- Jul 2013
- Age
- 41
- Posts
- 112
- Rep Power
- 0
Forecast for AUD/USD on October 28, 2021
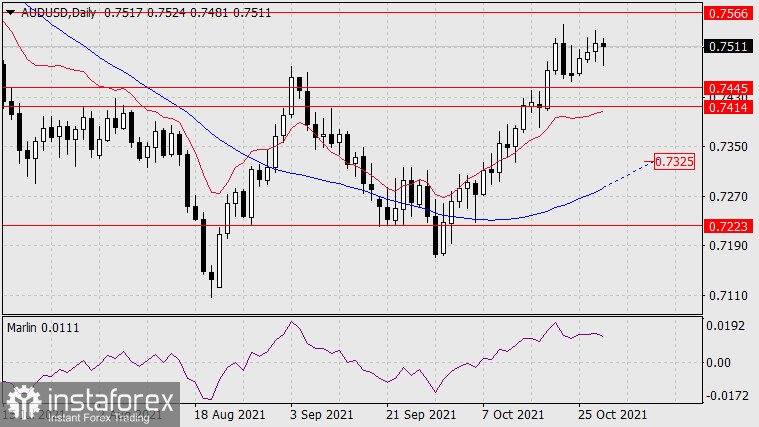
The Australian dollar is forming a sideways short-term trend.
On Wednesday, as in the previous two days, the Australian dollar continued to rise to the target level of 0.7566, set by the lows of March 25 and February 2 this year. Overcoming this level will open the next target of 0.7646 - the low on June 3. But in today's Asian session, the fall has blocked yesterday's growth, the Marlin Oscillator has outlined a downward reversal. This is probably a lateral movement before further growth. Unless, of course, the level of 0.7414 is overcome, which may lead to a decline to the MACD line on the daily in the area of 0.7325.
At 2.00 am ET Thursday, Destatis is scheduled to issue Germany's factory orders for December. Orders are forecast to climb 0.6 percent on month, reversing a 1.3 percent drop in November.
Ahead of the data, the euro traded mixed against its major rivals. While the euro rose against the franc, it held steady against the rest of major rivals. The euro was worth 1.1000 against the greenback, 120.90 against the yen, 1.0713 against the franc and 0.8471 against the pound as of 1:55 am ET.
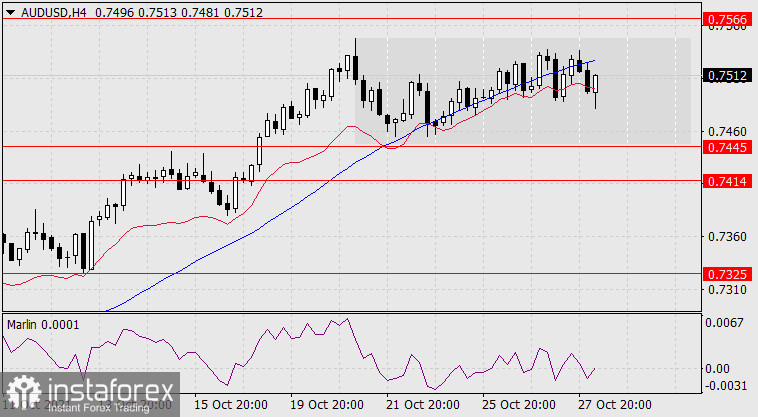
On the four-hour chart, the price settled below the MACD indicator line (blue), while the Marlin Oscillator entered negative territory. Short-term pressure on the price has increased. In general, the AUD/USD pair has no pronounced signals in either direction - the chance of quickly reaching the support of 0.7445 did not materialize with the support of such a scenario by technical indicators, but the pressure will remain for some time, the price will develop in a sideways range.
*The market analysis posted here is meant to increase your awareness, but not to give instructions to make a trade.[/B]
-
15-11-21, 14:19 #3
Senior Member
Just starting here
- Join Date
- Jul 2013
- Age
- 41
- Posts
- 112
- Rep Power
- 0
Trading plan for GBP/USD on November 15, 2021
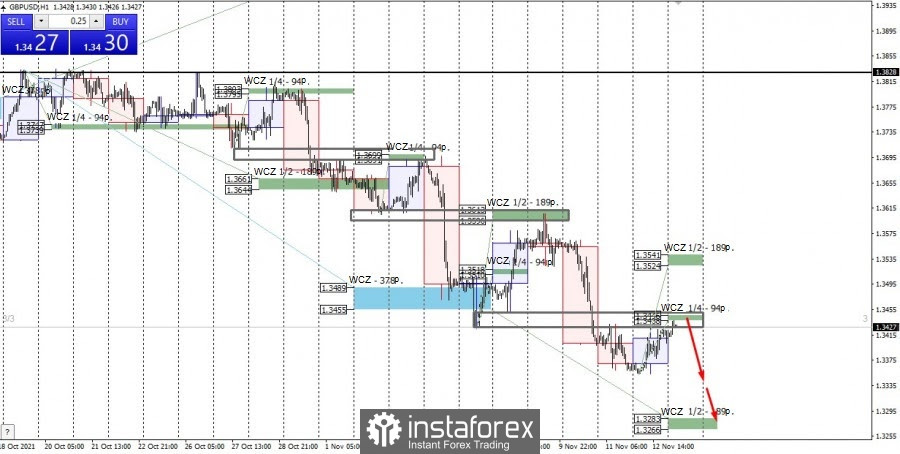
The GBP/USD pair's downward movement last Wednesday still leaves traces. Today, the pound has returned to its low of two weeks ago on November 5. The Weekly Control Zone 1/4 1.3446-1.3438 is set at the same mark.
These two facts speak about the importance of this zone. If the price fails to consolidate above the level of 1.3446 today and an absorption pattern is formed, then sales will come to the fore again. The first downward target is last week's low. The main medium-term target will be the WCZ 1/2 1.3283-1.3266. This makes it possible to get a favorable risk-to-profit ratio.
If today closes above the level of 1.3446, then the next target for selling the instrument will be the WCZ 1/2 1.3541-1.3524. They will find the most favorable prices for opening a short position there.
*The market analysis posted here is meant to increase your awareness, but not to give instructions to make a trade.
-
07-10-22, 07:14 #4
Senior Member
Just starting here
- Join Date
- Jul 2013
- Age
- 41
- Posts
- 112
- Rep Power
- 0
Forecast for EUR/USD on October 7, 2022
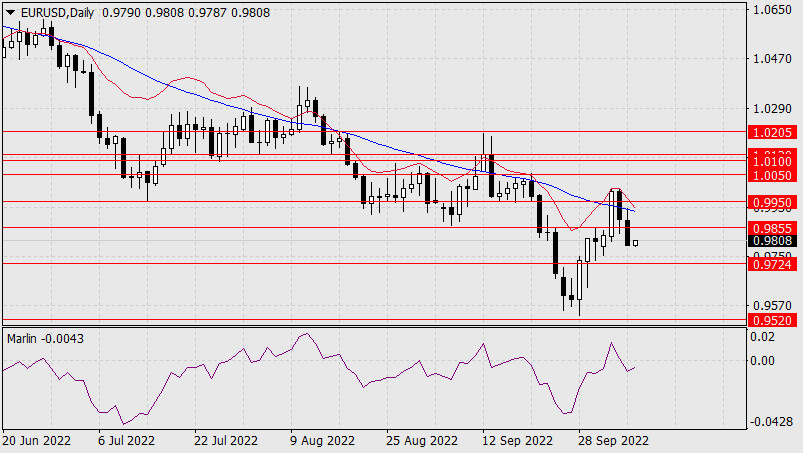
Yesterday the euro successfully overcame the support of 0.9855 and rushed towards the support of 0.9724. The euro is declining even faster than its growth in recent days. Consolidation under 0.9724 opens the 0.9520 target. Marlin Oscillator fixed in negative territory.
Employment data for September will be released today. The forecast for new jobs in the non-agricultural sector is 250,000, which is a very good indicator with an unemployment rate of 3.7%. The markets are seriously tuned in to such data, as yesterday all dollar assets fell in price, including commodities and stocks.
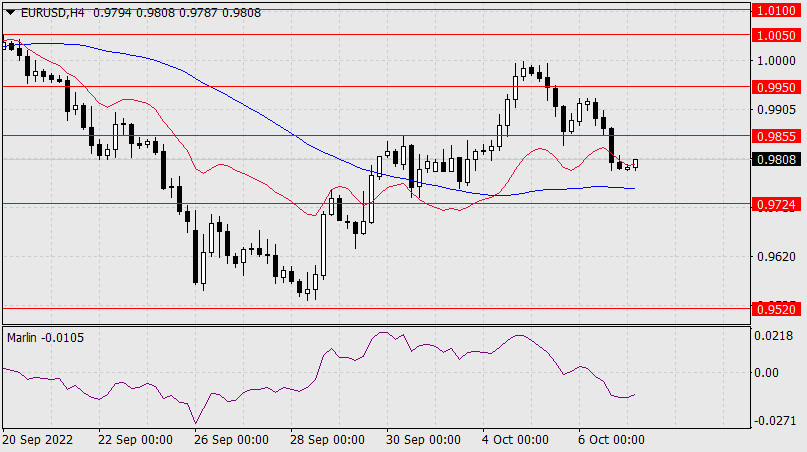
The price is preparing to attack the support of the MACD line on the four-hour chart. The MACD line itself is approaching the target level of 0.9724, so the price level is of key importance. The Marlin Oscillator is developing in the downward trend area.
*The market analysis posted here is meant to increase your awareness, but not to give instructions to make a trade.
-
30-08-23, 07:26 #5
Veteran Member
Just starting here
- Join Date
- Jun 2013
- Age
- 40
- Posts
- 4,044
- Rep Power
- 0
This week's pack of US data will decide the dollar's fate
This week, the news backdrop will be much stronger than in the previous one. The lion's share of essential reports will come from America, so I will focus on them in this article. Before delving into the data that could significantly affect the dollar's fate, I should note the labor market and unemployment reports are currently the most crucial because they, along with inflation, influence when the Federal Reserve will stop raising rates and start lowering them. Reports on GDP or business activity are nowhere near as influential as the aforementioned ones.
Analysis are provided by InstaForex
Read More https://ifxpr.com/45rRqzL
-
07-03-24, 11:27 #6
Member
Just starting here
- Join Date
- Feb 2016
- Posts
- 56
- Rep Power
- 0
Forex Analysis & Reviews: EUR/USD. Analysis for March 6th. The dollar is on the verge of a new decline
The wave analysis of the 4-hour chart for the EUR/USD pair remains unchanged. Over the past year, we have seen only three-wave structures of a larger scale that constantly alternate with each other. Currently, the construction of another three-wave structure is continuing - a downtrend that began on July 18 of last year. The presumed wave 1 is complete; wave 2 or b has become more complex three or four times but is now also complete as the decline of the pair has been ongoing for more than two months.
Alternatively, wave analysis may become significantly more complicated. The exchange rate of the EUR/USD pair rose by 15 basis points on Wednesday. Every day I say the same thing: market activity is currently so low that all price changes can be ignored. In addition to low market activity, the pair has been in a horizontal movement between Fibonacci levels 76.4% and 61.8% for over two weeks. Wave 2 in 3 or c may take on a three-wave form, implying a breakthrough of the 1.0881 mark. If this happens, the American currency may depreciate even more. However, there is no need to worry about this. Correctional waves often take on a three-wave form, so it can be said that everything is going according to plan.
Today, as well as Thursday and Friday, will be crucial for the American currency. In a couple of hours in America, reports on job vacancies and the number of new employees in the non-agricultural sector will be released, and Jerome Powell will speak in the US Congress. Tomorrow is another Powell speech, and the day after tomorrow is the nonfarm payrolls and unemployment reports. And this is not counting the ECB meetings and Christine Lagarde's speeches. Everything indicates that the last three working days of the week should be fiery.
For the current wave analysis to be preserved, at least not all of these events should increase demand for the euro. If at least half of the reports favor the dollar, and Lagarde and Powell do not change their previously voiced rhetoric, the dollar may depreciate within the wave plan. And then move on to building wave 3 in 3 or c. If this wave starts today or tomorrow, I'm fine with that too. I continue to consider only selling the pair.
Analysis are provided byInstaForex.
Read More
-
08-03-24, 14:07 #7
Member
Just starting here
- Join Date
- Feb 2016
- Posts
- 56
- Rep Power
- 0
Forex Analysis & Reviews: XAU/USD review and analysis: Gold looks poised for further gains
For eight consecutive days, the price of gold has been gaining strong positive momentum. Expectations that the Federal Reserve will begin to lower interest rates in June are keeping bulls on the U.S. dollar on the defensive and are a key factor directing flows towards the non-yielding yellow metal. Additionally, ongoing geopolitical tensions and economic problems in China provide support to this safe-haven asset.
Meanwhile, Minneapolis Fed President Neel Kashkari played down rumors of a more aggressive policy easing. This, in turn, prompted a modest rebound in U.S. Treasury yields and helped limit the potential decline of the dollar. However, tense conditions on the daily chart are currently preventing traders from entering new bullish positions ahead of the NFP report, which will be released today during the American session. From a technical perspective, the recent breakthrough above the $2,100 mark is considered a key trigger for the bulls.
Nevertheless, the Relative Strength Index (RSI) on the daily chart already indicates overbought conditions. Therefore, before preparing for the continuation of the established short-term upward trend, it would be prudent to wait for some short-term consolidation or a moderate pullback. Nevertheless, gold seems poised for further growth towards the psychological $2,200 mark. On the flip side, corrective declines can be viewed as an opportunity to buy, with a limited figure of around $2,100. This mark is a turning point that, in the case of a decisive breakthrough, could push the price of gold back to the $2,065 level. Some subsequent sales may imply that the XAU/USD pair might shift the balance in favor of bears.
Analysis are provided by InstaForex
Read More ifxpr.com/43b1Z9N
-
11-03-24, 12:05 #8
Member
Just starting here
- Join Date
- Feb 2016
- Posts
- 56
- Rep Power
- 0
Indicator Analysis of GBP/USD on March 11, 2024
Open trading account Open demo account Deposit money Money withdrawal Open trading account Open demo account Trend analysis (Fig. 1). The GBP/USD currency pair may move downward from the level of 1.2855 (closing of Friday's daily candlestick) to the 14.6% pullback level at 1.2837 (yellow dotted line). From there, an upward movement is possible to the upper fractal at 1.2892 (yellow dotted line). Fig. 1 (daily chart). Comprehensive analysis: Indicator analysis – down; Fibonacci levels – down; Volumes – down; Candlestick analysis – down; Trend analysis – up; Bollinger bands – up; Weekly chart – up. General conclusion: Today, the price may move downward from the level of 1.2855 (closing of Friday's daily candlestick) to the 14.6% pullback level at 1.2837 (yellow dotted line). From there, an upward movement is possible to the upper fractal at 1.2892 (yellow dotted line). Alternatively, from the level of 1.2855 (closing of Friday's daily candle), the price may move downward to the 23.6% pullback level at 1.2804 (yellow dotted line). From there, an upward movement is possible to the upper fractal at 1.2892 (yellow dotted line).
Analysis are provided by InstaForex
Read more: https://ifxpr.com/3PevvFY
-
12-03-24, 14:15 #9
Member
Just starting here
- Join Date
- Feb 2016
- Posts
- 56
- Rep Power
- 0
Analysis of transactions and tips for trading GBP/USD
The test of 1.2831 took place at a time when the MACD line moved downward from zero. This provoked a sell signal, which led to a price decrease of around 30 pips. The pair reached the target level of 1.2805.
Buying from this level for a rebound did not yield the expected results. Data on the UK's jobless claims, unemployment rate, and average earnings will come out today. The last indicator attracts the most attention, as a sharp decrease will weaken the position of pound, leading to a decline in the pair.
For long positions: Buy when pound hits 1.2829 (green line on the chart) and take profit at the price of 1.2857 (thicker green line on the chart). Growth will occur only after good and strong data on the UK labor market. When buying, ensure that the MACD line lies above zero or just starts to rise from it.
Pound can also be bought after two consecutive price tests of 1.2804, but the MACD line should be in the oversold area as only by that will the market reverse to 1.2829 and 1.2857. For short positions: Sell when pound reaches 1.2804 (red line on the chart) and take profit at the price of 1.2770. Pressure will return after an unsuccessful attempt to break through the local high. When selling, ensure that the MACD line lies below zero or drops down from it.
Pound can also be sold after two consecutive price tests of 1.2829, but the MACD line should be in the overbought area as only by that will the market reverse to 1.2804 and 1.2770. What's on the chart: Thin green line - entry price at which you can buy GBP/USD Thick green line - estimated price where you can set Take-Profit (TP) or manually fix profits, as further growth above this level is unlikely. Thin red line - entry price at which you can sell GBP/USD Thick red line - estimated price where you can set Take-Profit (TP) or manually fix profits, as further decline below this level is unlikely. MACD line- it is important to be guided by overbought and oversold areas when entering the market Important: Novice traders need to be very careful when making decisions about entering the market.
Before the release of important reports, it is best to stay out of the market to avoid being caught in sharp fluctuations in the rate. If you decide to trade during the release of news, then always place stop orders to minimize losses. Without placing stop orders, you can very quickly lose your entire deposit, especially if you do not use money management and trade large volumes. And remember that for successful trading, you need to have a clear trading plan. Spontaneous trading decisions based on the current market situation is an inherently losing strategy for an intraday trader.
Analysis are provided by InstaForex
Read more: https://ifxpr.com/3TdWXVx
-
08-07-24, 12:32 #10
Member
Just starting here
- Join Date
- Feb 2016
- Posts
- 56
- Rep Power
- 0
Forex Analysis & Reviews: Hot forecast for EUR/USD on July 8, 2024
Although 206,000 new jobs were created outside the agricultural sector, significantly exceeding the forecast of 160,000, the overall content of the US Department of Labor report turned out to be simply appalling. This was mostly due to the downward revision of previous data from 272,000 to 218,000. This means that for three consecutive months, fewer than 250,000 new jobs have been created, which is not even enough to maintain labor market stability. Consequently, the unemployment rate rose from 4.0% to 4.1%. In other words, unemployment has been rising for three consecutive months. This sharply increases the likelihood of interest rate cuts during the upcoming Federal Open Market Committee meeting, which led to the dollar's weakness. The issue lies in the extremely weak data, which were significantly worse than expected. Considering that today's economic calendar is practically empty, the market will be guided by other factors, particularly the dollar's oversold condition. In addition, the results of the early parliamentary elections in France are likely to disappoint the markets. This is not so much due to the defeat of President Macron's party but rather because of the clear victory of parties that the media describe as far-right. From the perspective of leading business publications, which significantly influence the markets, this is a highly negative factor. Thus, the dollar has every chance to recover some of its recent losses.
EUR/USD closed the week above the level of 1.0800, which in terms of technical analysis is a sign that the market sentiment is bullish. On the 4-hour chart, the RSI reached the overbought zone and left. Based on the absence of a complete corrective movement, we can conclude that at this time the market is reassessing long positions on the euro. On the same chart, the Alligator moving averages are headed upwards, which corresponds to the upward cycle. Outlook If we focus solely on the technical analysis, keeping the price above the level of 1.0800 may eventually lead to further growth for the euro, on the basis of which it is possible to test the local high of the medium-term trend. The bearish scenario will come into play in case of a pullback, if the price settles below the level of 1.0800 for at least a 4-hour period. In terms of complex indicator analysis, the short-term period does not have stable indicators since the price is stagnant. In the daily period, the bullish sentiment is still in force.
Analysis are provided by InstaForex.
Read more: https://ifxpr.com/4637Dwf
-
09-07-24, 10:29 #11
Member
Just starting here
- Join Date
- Feb 2016
- Posts
- 56
- Rep Power
- 0
Forex Analysis & Reviews: Hot forecast for EUR/USD on July 9, 2024
EUR/USD maintains a bullish bias after settling above the 1.0800 level. As a result, there is an increase in the volume of long positions. This may point to the recovery process in the euro. On the 4-hour chart, the RSI technical indicator is hovering in the upper area of 50/70, which points to the bullish sentiment. On the same chart, the Alligator moving averages are headed upwards, which corresponds to the upward cycle. Outlook If the price settles above the 1.0800 mark, it could climb to the 1.0900 level. The bearish will come into play if the price returns below the 1.0800 level.
Analysis are provided by InstaForex.
Read more: https://ifxpr.com/4eYrKj9
-
11-07-24, 09:56 #12
Member
Just starting here
- Join Date
- Feb 2016
- Posts
- 56
- Rep Power
- 0
Forex Analysis & Reviews: Technical Analysis of Weekly Price Movement of S&P 500 Index, Thursday July 11 2024.
Even though on the weekly chart the S&P 500 index still appears to be dominated by Buyers, this is indicated and confirmed by the price movement of #SPX which moves harmoniously in an upward channel and the price movement is above the EMA 20 & EMA 50, but with the appearance of deviations between price movements #SPX which makes higher-highs in its price movements while the MACD indicator makes higher-lows on the contrary, so in the next 1 to 2 weeks it has the potential to be corrected and weakened down to level 5322.39, but as long as the weakening correction does not penetrate below level 4946.59, this index will still has the opportunity to strengthen again to level 5919.63.
Analysis are provided by InstaForex.
Read more: https://ifxpr.com/3WhML0X
-
12-07-24, 12:11 #13
Member
Just starting here
- Join Date
- Feb 2016
- Posts
- 56
- Rep Power
- 0
Forex Analysis & Reviews: Hot forecast for EUR/USD on July 12, 2024
Inflation in the United States was expected to decrease from 3.3% to 3.1%, which in itself convinced the market of the imminent start of monetary policy easing by the Federal Reserve. However, US consumer inflation eased to 3.0% in June. As a result, the dollar immediately started to lose its positions quite significantly. The market is now convinced of two Fed rate cuts by the end of the year. The first rate cut is expected in September, and the second in December. These forecasts and expectations are quite justified. So, locally, the market is entering a phase where the USD stays lower. Of course, there will be pauses and minor pullbacks along this path. Something similar was observed yesterday, closer to the end of the U.S. trading session. Most likely, the pullback will continue today, and the market will try to settle slightly below current values. After that, the pair could move towards the dollar's decline.
During speculative growth, EUR/USD almost reached the level of 1.0900, and the volume of long positions decreased. As a result, the market experienced a minor pullback, which can be considered a process of regrouping trading forces. On the 4-hour chart, the RSI locally ended up in the overbought zone when it reached the resistance level of 1.0900. On the same chart, the Alligator's MAs are headed upwards, which reflects the quote's movement. Outlook To start a new wave of growth, the price must settle above the 1.0900 level. Otherwise, the current pullback may linger in the market. In terms of complex indicator analysis, a pullback is likely in the short term. Indicators signal an upward cycle in the intraday period.
Analysis are provided by InstaForex.
Read more: https://ifxpr.com/3zDZu5n
-
06-08-13, 13:50 #14
Veteran Member
Just starting here
- Join Date
- Jun 2013
- Age
- 40
- Posts
- 4,044
- Rep Power
- 0
Silver looking to move towards 19.00 before rallying

Technical outlook and chart setups:
The metal seems to hit resistance at 20.20/30 levels on Friday and the next probable move could be lower towards 19.00 level before rallying further up. Unlike Gold, the metal has been there for a while now without much wave movement. Resistance is at 20.50 level, while support is seen at 18.70 and lower. After this intermediary down move, the metal could be expected to rally towards 23.00 level and complete a 3 wave corrective rally. Aggressive trading strategy would be to remain short for now.
Trading recommendations:
Remain short, stop is above 20.50, and target is at 19.00.
More analysis - at instaforex.com
-
07-08-13, 12:54 #15
Veteran Member
Just starting here
- Join Date
- Jun 2013
- Age
- 40
- Posts
- 4,044
- Rep Power
- 0
GBP/CHF slide poised to accelerate. Remain short

Technical outlook and chart setups:
he currency pair tested the rising support line and fell back yesterday, as depicted in the Daily chart. Implications are bearish for GBP/CHF from here. Hence the recommendation is not changed - to maintain short positions for now. Immediate resistance would be at 1.4300 level, which was a high two days ago, followed by 1.44. Strong resistance is placed at 1.48 and 1.5. Looking into the wave structure, the next swing lows could be below 1.4 level in the coming days/weeks. Looking lower for now.
Trading recommendations:
Remain short, stop at 1.44, target is open
More analysis - at instaforex.com
-
09-08-13, 14:07 #16
Veteran Member
Just starting here
- Join Date
- Jun 2013
- Age
- 40
- Posts
- 4,044
- Rep Power
- 0
Silver tests backside of resistance line. Initiate short positions against 21.00 now

Technical outlook and chart setups:
The metal has breached through the resistance line now, around 20.25/30 levels. Hence, it is recommended to initiate short positions against 21.00. Immediate resistance is at 20.70/75, followed by 22.50/23.00; while support is around 18.70, followed by 18.25 levels. The wave structure indicates that a dip down ward movement towards 18.70/50 levels is possible before next leg higher up. The entire structure may be turning as a 3 wave pullback for now. Looking lower at least for the short-term prospect.
Trading recommendations:
Remain short, set stop at 21.00, target is at 18.50.
More analysis - at instaforex.com
-
13-08-13, 13:47 #17
Veteran Member
Just starting here
- Join Date
- Jun 2013
- Age
- 40
- Posts
- 4,044
- Rep Power
- 0
EUR/USD - Sell below 1.3387 - for August 13, 2013 (daily strategy)

Yesterday, the Euro in the Week opening left a gap that was covered at the beginning of the day, after it had a significant correction to the levels of the 15-day moving average, now we see that this bouncing, hope this stops at 1.3360 area, given that today's European session will be unveiled German ZEW Economic Sentiment, the analyst expected at 40.3, to be more optimistic compared to the previous month of 36.3, therefore we believe that this data can drive the euro but only few make a pullback, since it is located in area of high pressure bearish according the indicator of MACD and Momentum. Therefore, we recommend the next signal on the chart below.
More analysis - at instaforex.com
-
14-08-13, 13:19 #18
Veteran Member
Just starting here
- Join Date
- Jun 2013
- Age
- 40
- Posts
- 4,044
- Rep Power
- 0
USD/JPY intraday technical levels for August 14, 2013

TODAY's TECHNICAL LEVEL:
Resistance. 3: 98.72.
Resistance. 2: 98.52.
Resistance. 1: 98.33.
Support. 1: 98.09.
Support. 2: 97.90.
Support. 3: 97.70.
DESCRIPTION:
Please, pay attention to the levels of support 3 (97.70) and resistance 3 (98.72). Normally, when a level is touched, USD/JPY rebounds from the previous minimum by 10 to 20 pips, but if the levels are broken through by over 50 pips, then it will be a sign that this currency pair has found a trend today.
More analysis - at instaforex.com
-
15-08-13, 13:36 #19
Veteran Member
Just starting here
- Join Date
- Jun 2013
- Age
- 40
- Posts
- 4,044
- Rep Power
- 0
Silver inching towards 22.50 Resistance

Technical outlook and chart setups:
The metal has staged an impressive rally towards 22.20/30 levels till now. The 20.50 region should be past resistance turned support for the time being. A final push higher towards 22.50 would be required to confirm a major bullish reversal though. Resistance is at 22.50/23.00 levels, while support is at 19.20 and lower for now. Hence it is recommended to exit short positions, and watch out for the price reaction at 22.50 levels, before concluding a possible trade setup. The overall trend still remains bearish for now and a failure at 22.50 would warn a bearish reversal.
Trading recommendations:
Flat for now.
More analysis - at instaforex.com
-
21-08-13, 13:44 #20
Veteran Member
Just starting here
- Join Date
- Jun 2013
- Age
- 40
- Posts
- 4,044
- Rep Power
- 0
EUR/JPY technical analysis for August 21, 2013

Even the Bullish movement in all pairs with EUR has still dominated in the market base� on the rumors ECB wants to raise up its rate, and the Yen self has get a pressure because the lack of some fundamental data but now the EUR/JPY still moving in a ranging situation between the 129.25 to 131.00, maybe this happen because the market participant waiting the FOMC meeting minutes in a few day again.
RECOMMENDATION:
BUY Stop (Pending Order) at 130.76.
Take Profit at 130.90.
Stop Loss at 130.66.
More analysis - at instaforex.com

 Reply With Quote
Similar Threads
-
Forex News from InstaForex
By InstaForex Gertrude in forum Advertisement PlaceReplies: 2103Last Post: 16-02-24, 10:27 -
Forex Technical & Market Analysis FXCC
By alayoua in forum Advertisement PlaceReplies: 4Last Post: 07-07-16, 00:25 -
Weekly technical analysis for 3 - 7.12, 2012
By bellalca in forum Affiliate program networksReplies: 0Last Post: 04-12-12, 07:09


Bookmarks