
Results 2,061 to 2,080 of 2158
Thread: Instaforex Analysis
-
15-12-23, 06:13 #2061
 Veteran Member
Just starting here
Veteran Member
Just starting here

- Join Date
- Jun 2013
- Age
- 40
- Posts
- 4,044
- Rep Power
- 0

Forex Analysis & Reviews: Forecast for USD/JPY on December 15, 2023
USD/JPY
The USD/JPY pair continues to support the dollar's broad weakness. Yesterday, the yen strengthened by 97 pips, and the lower shadow of the daily candle tested the target support at 141.23. During the correction, the price approached the resistance level at 142.70 by this morning.
This level is strong, so we do not believe that there is a reason for the price to overcome it. After completing the correction, a consolidation could form before the level for 1-2 days. After that, we expect a new test of support at 141.23 and further down to 140.35, coinciding with the embedded line of the price channel.
On the 4-hour chart, the price and the Marlin oscillator formed a weak convergence. However, the oscillator quickly moved upward, so it may briefly linger at elevated values before turning downward.
Analysis are provided by InstaForex
Read More https://ifxpr.com/47SoMc6
-
18-12-23, 07:34 #2062
Veteran Member
Just starting here
- Join Date
- Jun 2013
- Age
- 40
- Posts
- 4,044
- Rep Power
- 0
Forex Analysis & Reviews: Forecast for EUR/USD on December 18, 2023
EUR/USD
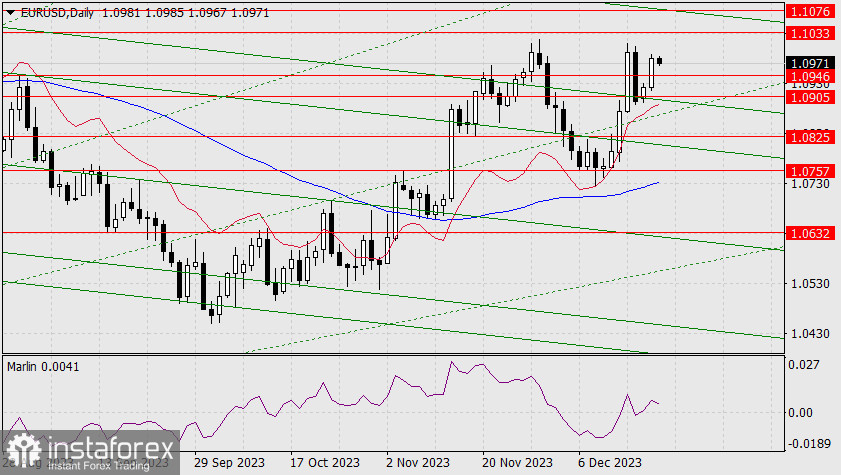
Friday's correction turned out to be quite intense and balancing on the verge of a trend change, as the price managed to overcome the strong support at 1.0905, and the Marlin oscillator returned to negative territory. Now, if the current day closes below the price channel line, below the level of 1.0905, the price could attack the lower Fibonacci ray and support at 1.0825.
However, the euro still has a chance to rise. In order to do so, the current daily candle should stay above the level of 1.0905, which will lead the Marlin oscillator to rise in the positive territory. Surpassing the 1.0946 mark will reopen the target of 1.1033 and then 1.1076.
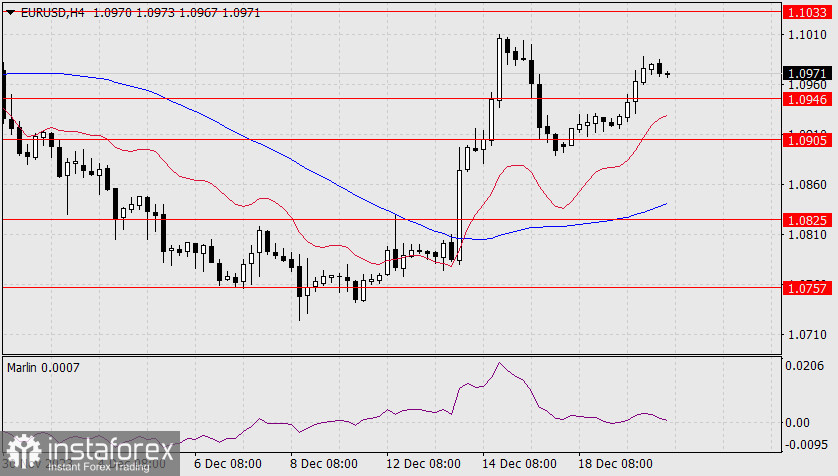
On the 4-hour chart, we can see that the corrective phase was just over 38.2%. The Marlin oscillator has not left the growth territory. There is a good chance that the price will turn from these levels. The uptrend remains intact, and in order to change it, the price needs to consolidate below 1.0825 and below the MACD line.
Such a deep correction only occurred with the euro. The Canadian dollar strengthened on Friday, Asia-Pacific currencies spent the day in consolidation, and this morning, the New Zealand dollar continues to rise. This means that on Friday, the euro qualitatively reacted to the weak eurozone PMI data. But today, the IFO indices for Germany for December will be released, and they are expected to increase. In particular, the value is expected to rise from 89.4 to 89.5. This supports the main scenario.
Analysis are provided by InstaForex
Read More https://ifxpr.com/3te72Jl
-
19-12-23, 07:47 #2063
Veteran Member
Just starting here
- Join Date
- Jun 2013
- Age
- 40
- Posts
- 4,044
- Rep Power
- 0
Forex Analysis & Reviews: Forecast for EUR/USD on December 19, 2023
EUR/USD
Yesterday, the euro closed with a white candle above the level of 1.0905, and the signal line of the Marlin oscillator quickly returned to the bullish territory. Although this isn't a signal that the pair will rise to the level of 1.1033, it removes the risk of a decline to 1.0825.
Perhaps the bulls still do not have enough long positions to overcome 1.0946, then we will see the price consolidating in the range of 1.0905/46. On the 4-hour chart, the price has settled above the level of 1.0905 and above the 38.2% Fibonacci correction level.
The Marlin oscillator is misleading the bulls, showing an intention to move below the neutral zero line. At the same time, this is a sign of an upcoming correction in the range of 1.0905/46. A consolidation below the lower band of the range will sharply increase the risks of a decline.
Analysis are provided by InstaForex
Read More https://ifxpr.com/3tr0nvq
-
20-12-23, 07:43 #2064
Veteran Member
Just starting here
- Join Date
- Jun 2013
- Age
- 40
- Posts
- 4,044
- Rep Power
- 0
Forex Analysis & Reviews: Forecast for EUR/USD on December 20, 2023
EUR/USD
The euro did not linger in the range of 1.0905/46, broke out of it and gained 57 pips on Tuesday. The signal line of the Marlin oscillator has settled in the positive territory, and the price can continue to move to the nearest target level of 1.1033 and rise to the upper band of the price channel, coinciding with the target level of 1.1076 (the peak of April 14).
Obviously, the pre-New Year rally is in full swing, if we count the stock market since October 30th. The Dow Jones stock index sets a new record every day. The S&P 500 is slightly behind. Yesterday, oil rose by 1.80%, and copper rose by 1.36%. The crisis, along with the euro's decline, is expected in the new year.
On the 4-hour chart, the price is progressing above the indicator lines, which are rising, and the Marlin oscillator has settled and is progressing in the uptrend territory. The possible correction is supported by the level of 1.0946, but overall, we expect the pair to rise to the specified target levels.
Analysis are provided byInstaForex.
Read More
-
22-12-23, 06:17 #2065
Veteran Member
Just starting here
- Join Date
- Jun 2013
- Age
- 40
- Posts
- 4,044
- Rep Power
- 0
Forex Analysis & Reviews: Forecast for AUD/USD on December 22, 2023
AUD/USD
Yesterday, the Australian dollar gained 71 pips and approached the target level of 0.6815, and the upper band of the local price channel.
The Marlin oscillator has been behaving nervously recently, but a break above 0.6830 opens the way for further growth with the initial target of 0.6897 - towards the peak of July 13 with an intermediate level of 0.6872.
On the 4-hour chart, the price has settled above the balance and MACD indicator lines, and the Marlin oscillator has stabilized in the uptrend territory. We are waiting for progress on this growth.
Analysis are provided by InstaForex
Read More https://ifxpr.com/48rPtUZ
-
25-12-23, 14:00 #2066
Veteran Member
Just starting here
- Join Date
- Jun 2013
- Age
- 40
- Posts
- 4,044
- Rep Power
- 0
Analysis of Gold for December 25, 2023 - Potential for the downside movement
Technical analysis:
Gold has been trading downside in the background but I found that supply overcame demand, which is good sign for the further downside movement.
Due to the rejection of the resistance level in the background and supply present, I see potential for the further drop towards lower references.
Downside objectives are set at $2.032 and $2.017
RSI oscillator is showing downside rotation toward 50 level, which is sign od indecision and the breakout of the rising lows.
Key resistance is set at $1.270
Analysis are provided by InstaForex
Read More https://ifxpr.com/3RUDs4P
-
26-12-23, 05:57 #2067
Veteran Member
Just starting here
- Join Date
- Jun 2013
- Age
- 40
- Posts
- 4,044
- Rep Power
- 0
Forex Analysis & Reviews: Forecast for EUR/USD on December 26, 2023
EUR/USD
So far, the euro has reached the first bullish target at 1.1033. Now, the target is 1.1076 (the peak of April 14) at the intersection with the upper band of the price channel. Surpassing this level will open up the target of 1.1150 (the July 27 high). But first, the price needs to consolidate above 1.1033.
Today, the United States will release housing price data. The October estimate suggests a growth of 0.5%, and the composite S&P/CS-20 index, excluding seasonal fluctuations, is expected to rise to 5.0% YoY from the previous 3.9% YoY. Such data may hinder the euro's growth. On the other hand, in thin markets, movements can be unpredictable depending on the goals of major players, and these goals were bullish just a week ago.
On the daily chart, the signal line of the Marlin oscillator has turned away from the upper band of the wedge, creating a risk of a pullback to the lower band of the wedge and an upward breakout of the line. Based on this scenario, the price may spend the entire day below the resistance of 1.1033 and only resume its upward movement tomorrow.
On the four-hour chart, the price is starting to consolidate before the reached level, and the Marlin oscillator has settled in the positive territory. Price development is occurring above the balance and MACD indicator lines. An uptrend in place.
Analysis are provided by InstaForex
Read More https://ifxpr.com/47cSnf5
-
27-12-23, 06:37 #2068
Veteran Member
Just starting here
- Join Date
- Jun 2013
- Age
- 40
- Posts
- 4,044
- Rep Power
- 0
Forex Analysis & Reviews: Forecast for EUR/USD on December 27, 2023
EUR/USD
The pre-New Year rally continues; S&P 500 up 0.42%, the euro up by 28 points, oil up by 1.99%, and gold up by 0.52%. The euro has surpassed the target resistance at 1.1033, and today, it opened above this level. Now the pair has one final leap to move towards 1.1076, where we might see profit-taking for the entire pre-New Year movement.
There is also room for growth in the stock market; the S&P 500 index is 0.9% away from the record high, and 2.28% away from the 4883 target along the price channel line (see the review from December 25).
On the 4-hour chart, the price has managed to consolidate above 1.1033.
Although the Marlin oscillator is in the positive territory, it feels weak, formally consolidating above the zero line. A delay in the price's growth may push the oscillator to move into negative territory. The least we can do for today is to close the day above yesterday's closing price.
Analysis are provided by InstaForex
Read More https://ifxpr.com/3vcZ8k3
-
28-12-23, 06:01 #2069
Veteran Member
Just starting here
- Join Date
- Jun 2013
- Age
- 40
- Posts
- 4,044
- Rep Power
- 0
Forex Analysis & Reviews: Technical Analysis of Intraday Price Movement of Gold Commodity Asset, Thursday December 28, 2023
Although currently Gold commodity assest still look strengthening where this is confirmed by the price movement which is above its Moving Average, but with the appearance of the Rising Wedge pattern and the deviation between price movement with Awesome Oscillator indicator, then in the near future, although gold will try to reach the level area of 2093.24-2107.79 but there is a potential for gold to fall down to its weakening up to the level of 2004.27, but this weakness potential will become invalid if the strengthen of gold still continue until it breaks above the level 2143.74.
Analysis are provided by InstaForex
Read More https://ifxpr.com/3THVLfa
-
29-12-23, 06:45 #2070
Veteran Member
Just starting here
- Join Date
- Jun 2013
- Age
- 40
- Posts
- 4,044
- Rep Power
- 0
Forex Analysis & Reviews: Forecast for EUR/USD on December 29, 2023
EUR/USD
Yesterday, the euro failed to settle above the level of 1.1076 and, with below-average volumes, returned below it. Reduced trading volumes tells us that major players are not closing long positions.
This morning, the price is rising again and pushing through the resistance at 1.1076. If it manages to stay above this mark, the 1.1185 target will become relevant again. Settling above 1.1185 will pave the way for the price to reach the target of 1.1280. On the daily chart, the Marlin oscillator edged down yesterday but has gone back to rising again in today's Asian session.
On the 4-hour chart, the price briefly settled below 1.1076 but quickly turned back up. This was supported by the Marlin oscillator, which reversed from the border of the downtrend territory. We expect the euro to rise further.
Analysis are provided by InstaForex
Read More https://ifxpr.com/3GXRkoT
-
02-01-24, 08:10 #2071
Veteran Member
Just starting here
- Join Date
- Jun 2013
- Age
- 40
- Posts
- 4,044
- Rep Power
- 0
Forex Analysis & Reviews: Forecast for EUR/USD on January 2, 2024
EUR/USD
In the final trading day of 2023, the euro fell by 25 pips on below-average volume, finding support at 1.1033. Since there was no significant profit-taking, we expect the uptrend to remain intact. A break above the level of 1.1076 opens up a substantial target like 1.1185, which is the November 2021 low and the March 2022 high. We could see a bullish potential at 1.1280. The Marlin oscillator has also corrected lower, visually preparing for a reversal into a new upward wave.
All price action and oscillator movements occur within an uptrend. It's worth noting that this progress is taking place within a medium-term green-colored ascending price channel. Even if there is a break below the 1.1033 support level, we will not hastily revise the main scenario.
On the 4-hour chart, the price is supported by the balance indicator line. The Marlin oscillator is in a bearish territory but may require a trigger to return to the bullish territory. Today's reports on the final estimates of the eurozone and U.S. industrial PMIs for December may serve as a catalyst. The forecasts remain unchanged (44.2 and 48.2, respectively), but tomorrow's Manufacturing ISM for December is projected to stand at 47.1, up from 46.7 in November. We can assume that today's final estimate of the Manufacturing PMI might surprise everyone and turn out to be better than expected. Such, albeit minor, optimism could sustain risk appetite and push stock markets and counter-dollar currencies into the green zone.
Analysis are provided by InstaForex
Read More https://ifxpr.com/48oewJ6
-
03-01-24, 06:08 #2072
Veteran Member
Just starting here
- Join Date
- Jun 2013
- Age
- 40
- Posts
- 4,044
- Rep Power
- 0
Forex Analysis & Reviews: Forecast for GBP/USD on January 3, 2024
GBP/USD
Amid investors' flight from risk on Tuesday, the British pound lost 111 pips and breached the support of the balance indicator line on the daily chart. This morning, the price quickly returned above the line, but the bulls' main goal for now is to close the day above the nearest resistance at 1.2645, otherwise, we may see a consolidation below this mark, and the bears could gain the upper hand, pushing the quote to 1.2524.
The Marlin oscillator has settled in a downtrend, so sellers have a good chance. If the price consolidates above 1.2645, the price could rise towards 1.2745, and a breakthrough of 1.2745 will provide an optimistic outlook towards 1.2930 - the upper band of a long-term price channel.
On the 4-hour chart, the price has settled below the balance and MACD indicator lines, as well as the level of 1.2645. The Marlin oscillator has also settled in negative territory. Considering the uptrend, we can consider the pound's decline as a short-term effect. The first signal for an upward move will be the price consolidating above the level of 1.2645, further confirmed by the price breaking above the MACD line and the 1.2705 mark. However, if the price fails to exhibit growth, it will fall, with 1.2524 as the target. We await further developments.
Analysis are provided by InstaForex
Read More https://ifxpr.com/3S5i0KP
-
04-01-24, 06:39 #2073
Veteran Member
Just starting here
- Join Date
- Jun 2013
- Age
- 40
- Posts
- 4,044
- Rep Power
- 0
Forex Analysis & Reviews: Forecast for EUR/USD on January 4, 2024
EUR/USD
Yesterday's US ISM business activity data for December showed improvement, but investors continued to move away from risk, with the S&P 500 declining by 0.80%, and the euro falling by 17 pips along with it. The manufacturing PMI rose from 46.7 to 47.4, and the employment index in the manufacturing sector increased from 45.8 to 48.1. The minutes from the latest FOMC meeting confirmed the December theses of Williams, Bostic, and Mester regarding the market's reassessment of the upcoming Federal Reserve policy easing. The US will release employment reports both today and tomorrow we expect market volatility to rise.
On the daily chart, the price has tested the target support level of 1.0905, and the Marlin oscillator's signal line is indicating a potential bullish reversal. Perhaps, good data on new jobs in the private sector will restore risk appetite, and the euro will rise towards the level of 1.1033. If the price consolidates below 1.0905, it increases the risk of a decline towards 1.0825 and further to 1.0790, the MACD indicator line.
On the 4-hour chart, Marlin is preparing for an upward reversal (the green area). Currently, nothing is disrupting the technical reversal moment. We are waiting for the ADP employment data in the private sector. The forecast is optimistic 115,000 jobs added compared to 103,000 in November.
Analysis are provided by InstaForex
Read More https://ifxpr.com/3NMwsog
-
05-01-24, 07:39 #2074
Veteran Member
Just starting here
- Join Date
- Jun 2013
- Age
- 40
- Posts
- 4,044
- Rep Power
- 0
Forex Analysis & Reviews: Forecast for EUR/USD on January 5, 2024
EUR/USD:
Yesterday's US employment data, as we anticipated, exceeded expectations. According to ADP, 164,000 jobs were created in the non-farm sector in December, compared to a forecast of 115,000 and 101,000 in November. Initial jobless claims also dropped to 202,000 from 220,000 the previous week (forecast was 216,000). These reports renewed optimism about today's Non-Farm Payrolls report and other unemployment sub-indices. Even the expected 170,000 new jobs in the non-farm sector are considered a good figure.
As a result, the Dow Jones inched up by 0.03% yesterday, while the S&P 500 was less responsive, with a -0.34% decline. However, European stock markets closed the day with gains, and the euro was up by 22 pips.
On the daily chart, we can see a price reversal from the balance indicator line and the target level of 1.0905. The Marlin oscillator is rising but has not yet left the bearish territory. Expectations are generally positive, with the price expected to reach target resistances at 1.1033, 1.1076, and 1.1185.
On the 4-hour chart, the price is visually rising, and the Marlin oscillator, after breaking away from the base marked by the green area, is approaching the boundary of the uptrend territory. The MACD line is very close to the 1.1033 level, emphasizing the significance of this resistance. Therefore, overcoming it could extend the price's growth in the medium-term.
Analysis are provided by InstaForex
Read More https://ifxpr.com/4aNss0A
-
08-01-24, 07:03 #2075
Veteran Member
Just starting here
- Join Date
- Jun 2013
- Age
- 40
- Posts
- 4,044
- Rep Power
- 0
Forex Analysis & Reviews: Forecast for EUR/USD on January 8, 2024
EUR/USD
As we anticipated in previous reviews, the US employment data came out better than expected. In the non-farm sector, 164,000 new jobs were created compared to the expected 130,000, and the unemployment rate remained at the November level of 3.7%, instead of the expected 3.8%. However, the proportion of the economically active population sharply decreased from 62.8% to 62.5%. This may be due to seasonal factors. The markets showed increased volatility in response to this data, with most assets, including currencies, gold, and even the Dow Jones, ending the day close to their opening levels.
The euro started the day with gains. The price is trying to move away from the support at 1.0905 in order to gravitate towards the target level of 1.1033. Breaking through the nearest resistance will open the path to 1.1076. By that time, the Marlin oscillator may have already risen above the zero line, providing fresh momentum for growth.
On the 4-hour chart, the price and Marlin oscillator have formed a convergence. The oscillator is already in positive territory, helping the price approach 1.1033. This level is strong and significant because the MACD line is located nearby.
Analysis are provided by InstaForex
Read More https://ifxpr.com/47teiiv
-
09-01-24, 07:08 #2076
Veteran Member
Just starting here
- Join Date
- Jun 2013
- Age
- 40
- Posts
- 4,044
- Rep Power
- 0
Forex Analysis & Reviews: Forecast for GBP/USD on January 9, 2024
GBP/USD
Yesterday, the British pound pierced through the resistance level at 1.2745 with its upper shadow, and today's opening price is exactly at this level, indicating further upward movement. Exchange Rates 09.01.2024 analysis
The Marlin oscillator crossed into the uptrend territory during the Asian session. A short-term rise is unfolding with the initial target at 1.2826. Beyond that, the price faces a challenging decision: to either surpass the upper band of the global descending channel around 1.2910 or break through it and reach the target level of 1.2940.
On the 4-hour chart, the price is trying to rise above the support at 1.2745. In doing so, it is moving above both indicator lines. The Marlin oscillator continues to adapt to the uptrend territory. We are looking for the price to reach the initial target level at 1.2826.
Analysis are provided by InstaForex
Read More https://ifxpr.com/3NUCNhC
-
10-01-24, 07:04 #2077
Veteran Member
Just starting here
- Join Date
- Jun 2013
- Age
- 40
- Posts
- 4,044
- Rep Power
- 0
Forex Analysis & Reviews: Forecast for EUR/USD on January 10, 2024
EUR/USD
The euro failed to develop an upward movement on Monday or Tuesday. Part of this is related to the U.S. Congress passing the budget for the current year, removing the threat of a shutdown. However, the stock market also showed some weakness yesterday, restraining the potential rise in risk currencies. However, the stock market's situation is more understandable it is waiting for a flow of corporate reports for the 4th quarter, waiting for new data on inflation in the United States, and waiting for clarity on interest rates. The Consumer Price Index (CPI) for December is forecasted to increase from 3.1% YoY to 3.2% YoY, while the core CPI may show a decrease from 4.0% YoY to 3.8% YoY. For major financial institutions reporting on Friday, profits are expected to range from $0.92 per share to $8.75 per share. For now, the outlook for the stock market is optimistic. We are waiting for the S&P 500 to surpass a historical high (4817), possibly within a week, and then it has three main targets: 4890, 5028, 5120. A reversal with a decline could occur from any of these levels in a few months, and divergences on longer timeframes (week, month) will be ready.
From this perspective, the euro certainly has the potential to rise in the coming weeks the direct correlation with the stock market remains intact, but there may be reversals within this upward movement.
At the moment, the price is moving above the support at 1.0905 but is already pushing through the daily balance indicator line. If the price closes below this level, this would pave the way for the price to reach the target of 1.0825, and the MACD line is approaching this area, tempting the euro to test this support's strength. However, even if the price breaches the support, the uptrend is unlikely to push the price to surpass 1.0730, which is the target level near the embedded line of the global price channel. The optimistic scenario is growth within the range of 1.1033/76 from current levels. We are waiting for tomorrow's US inflation data.
On the 4-hour chart, the price is falling below the balance indicator line, and the MACD line has turned downward. Therefore, the Marlin oscillator may not be able to withstand this pressure and will soon move into a downtrend territory. We have to wait for tomorrow's data, and the market will reveal its choice. To reiterate, if the market's choice is not in favor of the euro (risk), the move could largely be false.
Analysis are provided by InstaForex
Read More https://ifxpr.com/4aR1Vzr
-
11-01-24, 07:51 #2078
Veteran Member
Just starting here
- Join Date
- Jun 2013
- Age
- 40
- Posts
- 4,044
- Rep Power
- 0
Forex Analysis & Reviews: Forecast for EUR/USD on January 11, 2024
EUR/USD
Wednesday was generally spent waiting for today's US inflation data. However, optimism and risk appetite prevailed; the S&P 500 rose by 0.57%, gold fell by 0.26%, and the euro gained 40 pips and continues to rise this morning.
From this perspective, the euro certainly has the potential to rise in the coming weeks the direct correlation with the stock market remains intact, but there may be reversals within this upward movement.
On the daily chart, the euro is rising above the balance indicator line, but the Marlin oscillator has not yet left the downtrend territory. It may leave this area after the reports. In this case, the price may aim for the nearest level at 1.1033. The subsequent move above this level will open up the second target at 1.1076. Beyond that is 1.1185, the peak from March 2022.
On the 4-hour chart, the price has not yet received a full-fledged bullish signal, as it needs to move above the MACD line, above the 1.1018 level. In general, the nearest resistance for the price can be seen in the range of 1.1018-1.1033. The Marlin oscillator is confidently moving in the uptrend territory.
Analysis are provided by InstaForex
Read More https://ifxpr.com/3SbezSK
-
12-01-24, 06:58 #2079
Veteran Member
Just starting here
- Join Date
- Jun 2013
- Age
- 40
- Posts
- 4,044
- Rep Power
- 0
Forex Analysis & Reviews: Forecast for EUR/USD on January 12, 2024
EUR/USD
U.S. consumer prices increased more than expected in December: the so-called core Consumer Price Index (CPI) rose 3.9% from a year ago, compared with an estimated 3.8%, with November's value at 4.0% from a year earlier, and the CPI rose from 3.1% to 3.4% on a yearly basis in December. The monthly growth was 0.3%. The reaction to these figures was mainly seen in the stock market, where the S&P 500 initially lost 0.94%. However, the market eventually turned around, and the index closed the day down by only -0.07%, while the Dow Jones gained 0.04%. Investors did not change their opinion regarding the first rate cut in March; in fact, they increased market expectations from 67% to 70%, mostly factoring in geopolitical risks. The yield on 5-year US government bonds decreased from 3.97% to 3.87%. The euro closed the day at the same level as the previous day's closing price.
As a result, the price settled above the balance indicator line on the daily timeframe. The Marlin oscillator has not yet crossed into the positive territory but is close to doing so. The price is facing two target levels: 1.1033 and 1.1076 (the peak on April 14th). Beyond that, the price will have to fight for the 1.1185 level.
On the 4-hour chart, the technical picture has not changed. Only the MACD indicator line has slightly fallen and is now closer to the price at 1.1008. Overcoming this resistance will allow the price to confidently target the 1.1033 level. The Marlin oscillator is ready to support the price at any moment since it is in the uptrend territory.
Analysis are provided by InstaForex
Read More https://ifxpr.com/48xx5dK
-
15-01-24, 07:13 #2080
Veteran Member
Just starting here
- Join Date
- Jun 2013
- Age
- 40
- Posts
- 4,044
- Rep Power
- 0
Forex Analysis & Reviews: Forecast for GBP/USD on January 15, 2024
GBP/USD
Pound, consolidating above the level of 1.2745, closed the day 2 points higher. However, looking at the fluctuations, this may not be the case, especially since today the pair opened 5 points lower.
The signal line of the Marlin oscillator turned downward, and if the pair overcomes the January 11 low of 1.2689, the balance line could be broken. In this case, GBP/USD will head towards the support level of 1.2610. Overcoming this will push the pair to 1.2524. The MACD line may also head towards this level. After that, pound may bounce from 1.2524 to new yearly highs.
Important economic data for the UK will be released on Wednesday (CPI for December). Until then, do not expect strong movements in the pair.
On the four-hour chart, the pair broke through the MACD line, while the Marlin oscillator fell downward, signaling a short-term decline. Further movement could be towards 1.2689, 1.2657 and 1.2610.
Analysis are provided by InstaForex
Read More https://ifxpr.com/3U03KV1

 Reply With Quote
Similar Threads
-
Forex News from InstaForex
By InstaForex Gertrude in forum Advertisement PlaceReplies: 2103Last Post: 16-02-24, 10:27 -
Forex Technical & Market Analysis FXCC
By alayoua in forum Advertisement PlaceReplies: 4Last Post: 07-07-16, 00:25 -
Weekly technical analysis for 3 - 7.12, 2012
By bellalca in forum Affiliate program networksReplies: 0Last Post: 04-12-12, 07:09


Bookmarks