
Results 2,041 to 2,060 of 2158
Thread: Instaforex Analysis
-
15-11-23, 07:46 #2041
 Veteran Member
Just starting here
Veteran Member
Just starting here

- Join Date
- Jun 2013
- Age
- 40
- Posts
- 4,044
- Rep Power
- 0

Forecast for GBP/USD on November 15, 2023
GBP/USD:
After sharply rising on Tuesday, the British pound decided to take a break in the consolidation range of September 7-13 at 1.2447-1.2524. During this pause, the Marlin oscillator's signal line will discharge slightly and then be ready to continue the ascent.
Once the price surpasses 1.2524, the target will be 1.2617. Next is 1.2745, the peak of August 30. If the price falls below the nearest price channel line at 1.2415, it will significantly complicate the correction. The bulls must close above 1.2447.
On the 4-hour chart, the correction is also looming. The Marlin oscillator's signal line sharply turned down, but apparently, this was so that the price would not fall below the critical support after the oscillator. After a consolidation, we expect the price to continue rising.
Analysis are provided by InstaForex
Read More https://ifxpr.com/3QHw9vs
-
16-11-23, 07:21 #2042
Veteran Member
Just starting here
- Join Date
- Jun 2013
- Age
- 40
- Posts
- 4,044
- Rep Power
- 0
Analysis of Gold for November 16, 2023 - Key resistance cluster on the test
Gold has been trading sideways at the price of $1.961 but I found that key resistance sat the prie of $1.970 is on the test.
In case of the rejection of the key resistance cluster, I see potetnial for the further downside movement towards lower references at $1.948 and $1.921.
In case of the upside breakout of the resistance cluster and hold above, there is the chance for the rally towards $2.003
RSI oscillator is showing reading above 50, which is sign that buyers are in control.
Analysis are provided by InstaForex
Read More https://ifxpr.com/3QGfXL5
-
17-11-23, 06:16 #2043
Veteran Member
Just starting here
- Join Date
- Jun 2013
- Age
- 40
- Posts
- 4,044
- Rep Power
- 0
Forecast for USD/JPY on November 17, 2023
USD/JPY:
On the daily chart, the yen is coiling around the price channel line within a wide range but has not been able to settle above or below this line. Let's see if the price can do this today. If it consolidates below the price channel line, the price will try to challenge the support levels at 150.00 and the MACD line at 149.65. Overcoming the MACD line not only opens up the nearest target at 148.18 but also paves the way for a decline in the medium-term (140.93).
A day closing with a white candle, followed by Monday's close above the price channel line, provides the opportunity to overcome the target level of 151.95 and the price can rise to 153.25. This scenario does not look weak, as the Marlin oscillator is ready to repeat the bullish reversal from the zero line.
On the 4-hour chart, the price is forming a triangle pattern. If this is a triangle, we can expect at least one more upward movement. If this is not a potential triangle, a bearish breakout may follow. Also, take note that the price is progressing below both indicator lines, and the Marlin oscillator is in the bearish territory. Keep an eye on the price's behavior at the levels of 150.00 and 149.65.
Analysis are provided by https://ifxpr.com/49DqQGd
Read More https://ifxpr.com/49DqQGd
-
20-11-23, 06:10 #2044
Veteran Member
Just starting here
- Join Date
- Jun 2013
- Age
- 40
- Posts
- 4,044
- Rep Power
- 0
Forecast for EUR/USD on November 20, 2023
EUR/USD:
After fluctuating for some time, the euro rose on Friday, gaining more than 60 pips. It reached the target level of 1.0905. The signal line of the Marlin oscillator is turning upward towards the upper band of the ascending channel.
There is a high probability of a synchronous downward reversal of the Marlin oscillator from both the channel's boundary and the price from any target level (1.0946, 1.0977). Today, the price has been falling, so the pair can only show a stable upward movement if the price returns above 1.0905.
On the 4-hour chart, the price is rising, slightly pausing at 1.0905. But the potential divergence, when it forms, will indicate a more significant corrective decline.
Once the correction ends, we expect the price to continue rising towards the level of 1.1096, considering the intermediate resistances at 1.0935/46, 1.0977, 1.1033.
Analysis are provided by InstaForex
Read More https://ifxpr.com/3Rgr7Id
-
21-11-23, 08:32 #2045
Veteran Member
Just starting here
- Join Date
- Jun 2013
- Age
- 40
- Posts
- 4,044
- Rep Power
- 0
Forecast for EUR/USD on November 21, 2023
EUR/USD
Yesterday, the euro reached the 2-year descending price channel line and the target level of 1.0946. This morning, the price is trying to break above this level towards the nearest target at 1.0977. Once the price surpasses this mark, the next target will be 1.1033 (January peak).
The Marlin oscillator is not in a hurry to rise along with the price, so the risk of a corrective decline increases with each day. Overall, we expect the signal line of the oscillator to be tested at the upper band of the ascending channel.
On the 4-hour chart, the price is breaking above the resistance of 1.0946 with a desire to consolidate above it. The Marlin oscillator is turning upward, creating a risk of divergence with the price. However, the reversal is not characteristic of a divergence, so the upward movement has the advantage at the moment.
Analysis are provided by InstaForex
Read More https://ifxpr.com/3G6MQvN
-
22-11-23, 10:01 #2046
Veteran Member
Just starting here
- Join Date
- Jun 2013
- Age
- 40
- Posts
- 4,044
- Rep Power
- 0
Technical Analysis of Intraday Price Movement of Gold Commodity Asset, Wednesday, November 22 2023
On the 30 minutes chart of Gold commodity asset, there is the price movement which is above the Kumo, Chikou Span also above the price and Kumo and even though Tenkan Sen and Kinjun Sen above the Kumo, but intersect with the Death Cross, which means although the Gold is in the Bullish condition, but in the near future has the potential to corrected below, where this is also confirmed by the appearance of the hidden deviation between price movement with CCI indicator so that, in the near future Gold has the potential to corrected downward, but if the weakness doesn't exceed under the level 1988,80, then Gold has the potential to be strong again up to the level 2007,07.
Analysis are provided by InstaForex
Read More https://ifxpr.com/46mgSGh
-
23-11-23, 06:07 #2047
Veteran Member
Just starting here
- Join Date
- Jun 2013
- Age
- 40
- Posts
- 4,044
- Rep Power
- 0
Forex Analysis & Reviews: Hot forecast for EUR/USD on November 22, 2023
Market trends do not unfold continuously as periodic pullbacks could happen. That is exactly what happened yesterday, despite the extremely weak data on existing home sales in the US, which fell by 4.1%, and has been decreasing for five consecutive months, with a total reduction of 11.9%.
At the beginning of the year, US home sales declined by 6.0%, but in February, it improved slightly, showing a 13.8% increase. Even so, the cumulative decrease is quite significant, naturally not inspiring any optimism. This should have resulted in dollar weakening, but pound fell instead.
The Fed's hawkish stance on monetary policy could not be the reason as the meeting took place before the sharp slowdown in inflation became known. Most likely, the movement is a technical rebound, which means that dollar will show its expected decline soon, especially since today, data on durable goods orders will be published. The figure is expected to fall by 2.8%. The potential 5,000 increase in jobless claims may also spark further dollar weakening.
EUR/USD hit the lower range of the psychological level of 1.0950/1.1000, resulting in a decrease in the volume of long positions. This led to a pullback, which may also be due to the overbought condition of euro.
Looking at the RSI H4, there is an exit from the overbought area due to the pullback.
In the daily period, the indicator is moving near the 70 zone.
As for the Alligator H4 indicator, it ignored the pullback, with the moving MA lines pointing upwards.
Outlook
For further decline, traders need to keep the price below 1.0900, as that will spark a complete correction. Alternatively, there could be a decrease in the volume of short positions around the level of 1.0900, treating it as support. In this scenario, there will be another attempt to break the psychological level of 1.1000.
The complex indicator analysis points to an upward cycle in the short-term, medium-term and intraday periods.
Analysis are provided by InstaForex
Read More https://ifxpr.com/3sBwpo8
-
23-11-23, 06:44 #2048
Veteran Member
Just starting here
- Join Date
- Jun 2013
- Age
- 40
- Posts
- 4,044
- Rep Power
- 0
Forex Analysis & Reviews: Forecast for GBP/USD on November 23, 2023
GBP/USD:
Yesterday, the low was 1.2448, which is approximately the trough since September 7th. In general, the support is not weak, as the price lingered on this mark for five days since September. Now the price could break above the level of 1.2524. If the price stays above this mark, the next target could be 1.2645. The brewing divergence between the price and the Marlin oscillator is losing its strength.
Now the signal line of the oscillator takes on a wedge shape. We could witness a bullish breakout from the wedge. On the 4-hour chart, the price turned up from the MACD line. The Marlin oscillator has already moved to the bearish territory, so the price may linger a bit before the resistance at 1.2524.
The UK Manufacturing PMI for November, which will be released today, is forecasted to rise from 44.8 to 45.0. Therefore, the pound has the opportunity to rise, even if it the United States is celebrating a holiday today.
Analysis are provided by InstaForex
Read More https://ifxpr.com/47rzdmJ
-
24-11-23, 06:47 #2049
Veteran Member
Just starting here
- Join Date
- Jun 2013
- Age
- 40
- Posts
- 4,044
- Rep Power
- 0
XAU/USD H4 I Falling to support?
The XAU/USD pair is showing bearish potential, with a significant support at 1985.14, known as an overlap support. If the price drops further, the 2nd support at 1968.63, a swing low support, may offer a defensive stance.
On the upside, the 1st resistance at 1996.02 serves as an overlap resistance, and overcoming it could be challenging. Above that, the 2nd resistance at 2006.90, which is a multi-swing high resistance, could cap the upside.
Analysis are provided by InstaForex
Read More https://ifxpr.com/47qbwvf
-
28-11-23, 08:57 #2050
Veteran Member
Just starting here
- Join Date
- Jun 2013
- Age
- 40
- Posts
- 4,044
- Rep Power
- 0
Forecast for EUR/USD on November 28, 2023
EUR/USD
After yesterday's bounce from the support of the green channel line, the price rose above the resistance at 1.0946, closing the day with a white candle. However, the signal line of the Marlin oscillator did not return to its own ascending channel and even strengthened the downward movement.
There is a risk to continuing the upward movement; the price can turn into a correction at any time. Nevertheless, the main bullish scenario is still valid; Marlin simply annuls the current channel and enters the formation of some other formation. However, in order to confirm the growth, Marlin must still turn upwards. The target level of 1.1033 remains relevant.
On the 4-hour chart, yesterday, the price tried to attack the support of the MACD indicator line, but failed. The signal line of the Marlin oscillator turned upward from the zero line. The uptrend may strengthen. We are waiting for the price at the nearest target level. To develop a correction, the price must overcome yesterday's low at 1.0926. The first corrective target will be 1.0905.
Analysis are provided by InstaForex
Read More https://ifxpr.com/3N1TZ4e
-
30-11-23, 08:37 #2051
Veteran Member
Just starting here
- Join Date
- Jun 2013
- Age
- 40
- Posts
- 4,044
- Rep Power
- 0
XAU/USD Day I Potential bearish reversal?
The XAU/USD is currently positioned for a potential bearish reversal, The chart is currently encountering major resistance levels, suggesting a potential bearish reversal.
The 1st resistance at 2050.34 is identified as a multi-swing high resistance. This implies that it's a significant barrier where selling interest could intensify, potentially triggering a reversal in the XAU/USD (Gold) market.
The 2nd resistance at 2079.54 is also noted as a swing high resistance, further reinforcing the potential resistance factors for the precious metal.
On the support side,
The 1st support at 2005.70 is categorized as a pullback support. This suggests that it's a significant level where buying interest may emerge, potentially providing some support for XAU/USD.
The 2nd support at 1951.77 is another support level identified as an overlap support. This adds further significance to this support level, indicating it as a potential area where buyers might become active, potentially mitigating the bearish reversal.
Analysis are provided by InstaForex
Read More https://ifxpr.com/3uKitZj
-
04-12-23, 10:36 #2052
Veteran Member
Just starting here
- Join Date
- Jun 2013
- Age
- 40
- Posts
- 4,044
- Rep Power
- 0
AUD/USD Update for December 04, 2023 - Berish divergence on the oscillator
Technical analysis:
AUD/USD has been trading downside this morning and I found rejection of the previous swing high at 0.6680, which is good sign for the further downside movement.
Due to the rejection of the previous swing high and the bearish divergence on the RSI oscillator, I see potential for the further drop towards lower references.
Downside objectives are set at the price of 0.6570 and 0.6524
RSI oscillator is showing fresh bearish divergence in the background, which is sign for the downside rotation.
Key resistance is set at the price of 0.6680
Analysis are provided by InstaForex
Read More https://ifxpr.com/41mSwM1
-
05-12-23, 07:31 #2053
Veteran Member
Just starting here
- Join Date
- Jun 2013
- Age
- 40
- Posts
- 4,044
- Rep Power
- 0
USD/CAD I Bearish Reversal?
The USD/CAD chart is showing signs of a potential bearish reversal, with significant support and resistance levels in play.
Resistance Levels:
At 1.35788, the 1st resistance level is characterized as "Pullback resistance." This level signifies a zone where selling pressure may emerge, potentially hindering upward momentum. Additionally, the 2nd resistance level at 1.35280 is identified as "An Overlap resistance," reinforcing its role as a significant resistance zone.
Support Levels:
On the support side, the 1st support level at 1.34893 is labeled as "Swing low support." This level implies a potential area where buying interest may emerge, serving as a crucial support zone. Similarly, the 2nd support level at 1.34304 is characterized as "Swing low support," reinforcing its potential to provide support to the price.
Analysis are provided by InstaForex
Read More https://ifxpr.com/484bYPs
-
06-12-23, 08:41 #2054
Veteran Member
Just starting here
- Join Date
- Jun 2013
- Age
- 40
- Posts
- 4,044
- Rep Power
- 0
XAU/USD H4 I Bullish Bounce?
The XAU/USD chart suggests the potential for a bullish bounce, with significant support and resistance levels at play.
Support Levels:
At 2009.00, the 1st support is characterized as "An Overlap support." This level signifies a potential area where buying interest may emerge, potentially facilitating a bounce. Similarly, the 2nd support at 1991.00 is also identified as "An Overlap support," reinforcing its potential significance in providing support to the price.
Resistance Levels:
On the resistance side, the 1st resistance level at 2034.68 is labeled as "An Overlap resistance." This level represents a notable barrier to further upward price movement and warrants attention from traders. Additionally, the 2nd resistance at 2051.18 is characterized by "Pullback resistance," further emphasizing its role as a significant resistance zone.
Analysis are provided by InstaForex
Read More https://ifxpr.com/3T7KuV5
-
07-12-23, 06:16 #2055
Veteran Member
Just starting here
- Join Date
- Jun 2013
- Age
- 40
- Posts
- 4,044
- Rep Power
- 0
USD/JPY Day I Bearish continuation expected?
The USD/JPY chart is currently indicating the potential for a bearish breakout, with significant support and resistance levels at play.
Support Levels:
At 144869.00, the 1st support is characterized as "An Overlap support." This level signifies a potential area where buying interest may emerge, potentially preventing further downward movement. Additionally, the 2nd support at 141.98 is identified as "An Overlap support," further reinforcing its potential significance in providing support to the price.
Resistance Levels:
On the resistance side, the 1st resistance level at 148.28 is labeled as "An Overlap resistance." This level represents a notable barrier to further upward price movement and warrants attention from traders.
Analysis are provided by InstaForex
Read More https://ifxpr.com/3RtCT1R
-
08-12-23, 14:58 #2056
Senior Member
Just starting here
- Join Date
- Jul 2013
- Age
- 41
- Posts
- 112
- Rep Power
- 0
Forecast for AUD/USD on December 8, 2023
Yesterday, the Australian dollar, with overlaps, covered the entire range of levels 0.6547-0.6612. It sharply grew when the Marlin oscillator's signal line turned from the zero line.
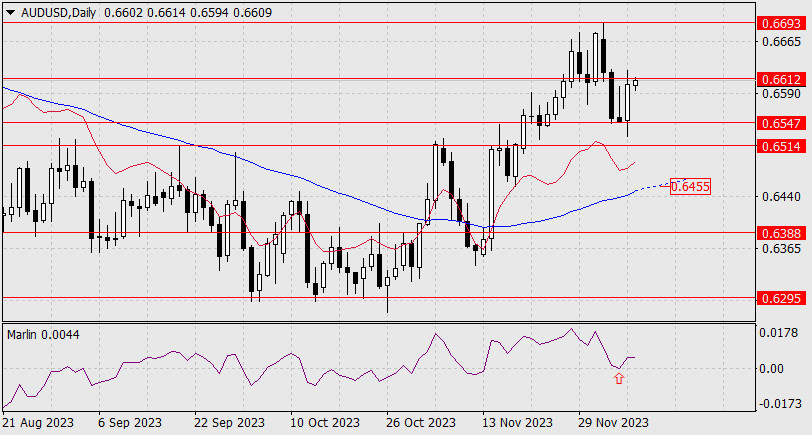
According to technical rules, the pair can rise further by surpassing the previous day's high (0.6623), but since the US will release important data today, there may be a false breakout above 0.6623.
According to technical rules, the pair can rise further by surpassing the previous day's high (0.6623), but since the US will release important data today, there may be a false breakout above 0.6623.
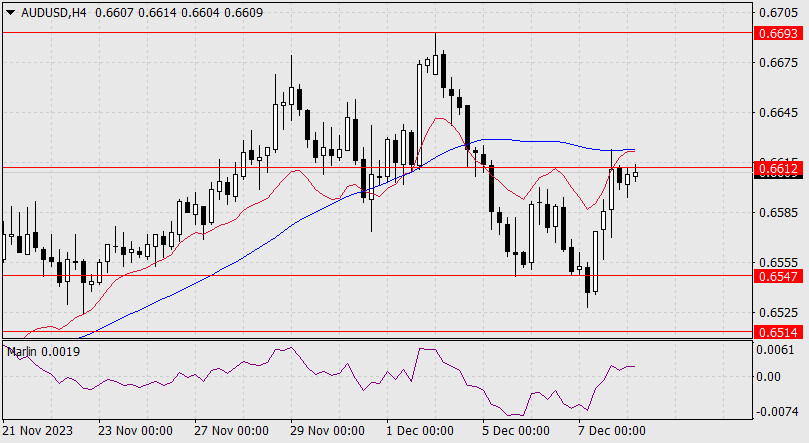
On the 4-hour chart, the price is consolidating just before the resistance level of 0.6612. The MACD line is slightly above it, precisely at yesterday's high. Consolidating above it will signal further growth. The Marlin oscillator is already in the uptrend territory. We are waiting for the resolution of the situation with the release of the US data.
Analysis are provided byInstaForex.
Read More
-
11-12-23, 06:10 #2057
Veteran Member
Just starting here
- Join Date
- Jun 2013
- Age
- 40
- Posts
- 4,044
- Rep Power
- 0
Forex Analysis & Reviews: Forecast for EUR/USD on December 11, 2023
EUR/USD
Friday's U.S. labor data turned out better than expected. The result was reflected in a decrease in the unemployment rate from 3.9% to 3.7%. The balance indicator line stopped the initial downward movement in response to the news. This was evidently influenced by the risk appetite, as the S&P 500 stock index grew by 0.41%. It is very close to continuing its growth in the medium-term, and to achieve this, the quote needs to surpass the year's high of 4612 (July 27), paving the way for the pair to reach the record target of 4816 (January 2022).
From this perspective, the euro's growth is limited to the time when the S&P 500 continues to rise. Synchronization with this timeframe gives the first serious target level of 1.1076 the upper band of the descending price hyperchannel, coinciding with the peak on April 14 (December 21-22).
On the 4-hour chart, a double convergence has formed, which could provide the initial momentum in order for the price to rise further so it can consolidate above 1.0825. This would mean settling above the nearest embedded line of the price channel, marked on the daily chart. Subsequent consolidation above the MACD line (1.0850) would mean overcoming the Fibonacci ray on the daily chart and pave the way for the pair to reach the target level of 1.0905. Considering the upcoming Federal Reserve meeting, the euro's growth could be quite strong.
Analysis are provided by InstaForex
Read More https://ifxpr.com/3tf6iUb
-
12-12-23, 06:22 #2058
Veteran Member
Just starting here
- Join Date
- Jun 2013
- Age
- 40
- Posts
- 4,044
- Rep Power
- 0
Forex Analysis & Reviews: Forecast for EUR/USD on December 12, 2023
EUR/USD
In the previous review, we tied the rise of counter-dollar currencies to the development of risk sentiment in the broader market. Yesterday, the S&P 500 stock index surpassed the nearest peak from July 27 (4612), and now it has a good target at the level of 4818, which is a record high (January 2022). Oil has risen slightly. Yields on US government bonds have not changed for the third day in anticipation of tomorrow's Federal Reserve meeting.
On the daily chart, the price has consolidated above the level of 1.0757. The Marlin oscillator is slowly turning upward. If there are no significant events that will hinder the euro's way, the price will continue to rise towards the target level of 1.0825.
A potential bullish breakout, in continuation of the decline from November 29, will take place if the price surpasses the support of the MACD line in the area of 1.0703. The first bearish target will be 1.0632. Exchange Rates 12.12.2023 analysis
On the 4-hour chart, the price is consolidating symbolically above the support of 1.0757. The signal line of the Marlin oscillator, after the previous convergence, entered the uptrend territory. Overcoming the level of 1.0825 will support the uptrend, as resistance is strengthened by the approaching MACD line.
Analysis are provided by InstaForex
Read More https://ifxpr.com/3t4EIcl
-
13-12-23, 09:29 #2059
Veteran Member
Just starting here
- Join Date
- Jun 2013
- Age
- 40
- Posts
- 4,044
- Rep Power
- 0
Forecast for EUR/USD on December 13, 2023
EUR/USD
So, yesterday's US inflation data turned out to be positive for the euro. The core CPI for November remained at the previous 4.0% YoY, while the CPI decreased from 3.2% YoY to 3.1% YoY. Such an optimistic trend of decreasing inflation could be reflected in today's dot plot projections on interest rates by FOMC members.
Today, the euro may surpass yesterday's high and continue to rise.
Yesterday, the upper shadow reached the target level of 1.0825. According to the main scenario, we expect a breakout and the euro to rise towards 1.0905. The second target is 1.0946.
On the 4-hour chart, the price reached the MACD indicator line and retraced slightly downwards. The price settled above the balance line indicator, and the Marlin oscillator settled in the uptrend territory. If the price consolidates above 1.0825, it will mean consolidation above the MACD line. We expect the euro to continue rising according to the main plan.
Analysis are provided by InstaForex
Read More https://ifxpr.com/3Nq7Rpj
-
14-12-23, 07:43 #2060
Veteran Member
Just starting here
- Join Date
- Jun 2013
- Age
- 40
- Posts
- 4,044
- Rep Power
- 0
Forex Analysis & Reviews: Forecast for AUD/USD on December 14, 2023
AUD/USD
The Australian dollar sharply strengthened after yesterday's Federal Reserve meeting up 100 pips compared to the euro's 80-pip rise. In today's Asian session, the pair continued to rise at an even greater speed, and has already surpassed the target level of 0.6693. With that said, we now expect the uptrend to move forward towards the target levels of 0.6775 and 0.6815 (the average value of the peaks in April and May).
A slight move of the Marlin oscillator's signal line into negative territory (red arrow) is now considered a false move, afterwards we witnessed movement into the overbought territory.
On the 4-hour chart, the price is trying to consolidate above the level of 0.6693. If it successfully manages to consolidate, this would automatically support the pair's rise to 0.6775.
Analysis are provided by InstaForex
Read More https://ifxpr.com/48ekxHJ

 Reply With Quote
Similar Threads
-
Forex News from InstaForex
By InstaForex Gertrude in forum Advertisement PlaceReplies: 2103Last Post: 16-02-24, 10:27 -
Forex Technical & Market Analysis FXCC
By alayoua in forum Advertisement PlaceReplies: 4Last Post: 07-07-16, 00:25 -
Weekly technical analysis for 3 - 7.12, 2012
By bellalca in forum Affiliate program networksReplies: 0Last Post: 04-12-12, 07:09


Bookmarks