
Results 2,001 to 2,020 of 2158
Thread: Instaforex Analysis
-
12-09-23, 07:23 #2001
 Veteran Member
Just starting here
Veteran Member
Just starting here

- Join Date
- Jun 2013
- Age
- 40
- Posts
- 4,044
- Rep Power
- 0

NZDUSD H4 | Falling to 1st support?
The NZD/USD chart currently shows a bullish trend with potential for further upward movement. The 1st resistance at 0.5930, coinciding with the 50.00% Fibonacci retracement, is a key level that may impede bullish progress. Similarly, the 2nd resistance at 0.5992 is also significant for potential resistance.
On the downside, the 1st support at 0.5891 aligns with the 61.80% Fibonacci retracement and serves as a strong support level. The 2nd support at 0.5862, identified as a pullback support, adds to the support zone.
Analysis are provided by InstaForex
Read More https://ifxpr.com/3LhemcE
-
15-09-23, 07:34 #2002
Veteran Member
Just starting here
- Join Date
- Jun 2013
- Age
- 40
- Posts
- 4,044
- Rep Power
- 0
GBPUSD H4 | Bearish Continuation Expected?
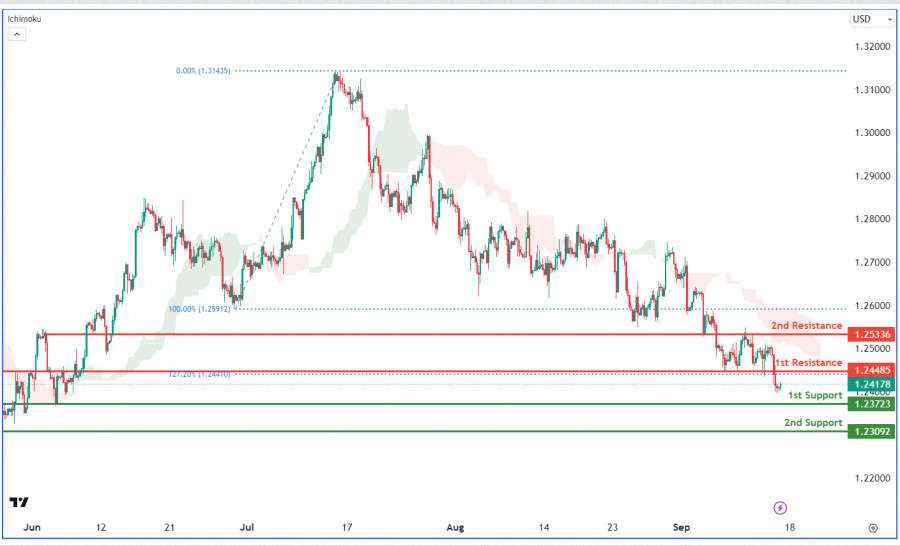
The GBP/USD chart currently shows a bearish momentum due to trading below the bearish Ichimoku cloud. This could lead to a continued bearish movement towards the significant 1st support level at 1.2372, which is marked as an overlap support. Additionally, the 2nd support at 1.2309 is recognized as a swing low support.
On the resistance side, the 1st resistance level at 1.2448 is a pullback resistance, possibly hindering upward movement. The 2nd resistance at 1.2533 is an overlap resistance, suggesting its potential as a point of reversal or resistance.
Analysis are provided by InstaForex.
Read More
-
18-09-23, 07:16 #2003
Veteran Member
Just starting here
- Join Date
- Jun 2013
- Age
- 40
- Posts
- 4,044
- Rep Power
- 0
GBPUSD Day | Bearish Continuation Expected?
The GBP/USD chart displays a dominant bearish trend, emphasized by its position below the bearish Ichimoku cloud and a descending trend line. Key supports stand at 1.2293, backed by the 78.60% Fibonacci Projection, and 1.2182, aligned with the 100% Fibonacci Projection. Resistances are identified at 1.2418 and 1.2632, with the latter being an overlap resistance. The overall outlook remains bearish.
Analysis are provided by InstaForex
Read More https://ifxpr.com/3PHlotS
-
19-09-23, 07:50 #2004
Veteran Member
Just starting here
- Join Date
- Jun 2013
- Age
- 40
- Posts
- 4,044
- Rep Power
- 0
Forecast for GBP/USD on September 19, 2023
The British pound closed Monday at the same level as Friday's closing level. The Marlin oscillator rose, reinforcing the double convergence with the price. We can see that the signal line of the oscillator is converging into a wedge, and an upward exit (most likely) from it will fuel the price growth.
The nearest bullish target is 1.2547, followed by 1.2617. The third target is 1.2684. The MACD indicator line is approaching this level.
On the 4-hour chart, we see a build up in the convergence. A break above 1.2444 will also correspond to Marlin's move into the bullish territory. Such a pattern will support the pound. We await the results of tomorrow's Federal Reserve meeting.
Analysis are provided by InstaForex
Read More https://ifxpr.com/3ZuRtbJ
-
20-09-23, 08:11 #2005
Veteran Member
Just starting here
- Join Date
- Jun 2013
- Age
- 40
- Posts
- 4,044
- Rep Power
- 0
Forex Analysis & Reviews: Technical Analysis of Intraday Price Movement of USD/CAD Commodity Currency Pairs, Wednesday, September 20 2023
From the 4-hour chart of The Lonnie, it can be clearly seen that Sellers are very dominant, this can be seen from the price movement which moves regularly and harmoniously in the Pitchfork channel which dips downwards and the price movement is below the WMA (20) with a downward sloping slope as well as the CCI indicator has succeeded breaking below the three main levels (100, 0, & -100), but currently it appears that USD/CAD is being corrected upwards to test the SBR (support Become Resistance) level at the level 1.3494. As long as this upward correction does not breaks and close above the level 1.3550, then USD/CAD has the potential to continue its decline back to level 1.3422 as the main target and level 1.3380 as the second target if momentum and volatility support it.
Analysis are provided by InstaForex
Read More https://ifxpr.com/3LtYp30
-
25-09-23, 07:49 #2006
Veteran Member
Just starting here
- Join Date
- Jun 2013
- Age
- 40
- Posts
- 4,044
- Rep Power
- 0
GBPUSD Day | Bouncing off support?
The GBP/USD chart shows a bearish trend, with focus on the 1st support at 1.2089, significant due to the convergence of the 127.20% Fibonacci Extension and the 78.60% Fibonacci Retracement. The 2nd support is at 1.1845, a historical swing low. On the resistance side, the 1st resistance is at 1.2311, a pullback resistance aligned with the 61.80% Fibonacci Retracement, serving as a potential barrier.
Analysis are provided by https://ifxpr.com/3Q0B3oB
Read More https://ifxpr.com/3Q0B3oB
-
26-09-23, 07:42 #2007
Veteran Member
Just starting here
- Join Date
- Jun 2013
- Age
- 40
- Posts
- 4,044
- Rep Power
- 0
Forecast for EUR/USD on September 26, 2023
EUR/USD
Once again, the euro is following an alternative scenario. Yesterday, the day closed with a black candle below the support at 1.0613 and below the Fibonacci channel line. The price is heading towards the target at 1.0552. The euro has a saw-toothed structure of decline, typical of corrective movements, and this correction, since July 18th, is clearly prolonged. The likely reason for this is the ongoing decline in the stock market. Now, a crisis correlation (the decline of both the stock market and the dollar) is possible in the event of a U.S. budget collapse - in the event of an emergency reduction in budget expenditures. U.S. lawmakers have a deadline until October 1st.
The signal line of the Marlin oscillator on the daily chart has returned to the wedge, slightly modifying it but maintaining the priority of breaking above it. We probably shouldn't expect strong movement until we reach Monday, October 2. If the budget issue in the United States is resolved by a certain deadline, we may see an appetite for risk - growth in the stock market and the euro. Thus, the single currency still has a bullish bias. Only a clearly interpreted and protracted crisis will shift the priority (our target is 0.9338).
On the 4-hour chart, the price is decreasing after a series of unsuccessful attempts to overcome the MACD line and the balance line. Marlin has expended all its strength for growth, and it will be difficult for it to recover now. We will likely see a sideways trend until Monday.
Analysis are provided InstaForex
Read More https://ifxpr.com/3PA6zZ7
-
28-09-23, 07:20 #2008
Veteran Member
Just starting here
- Join Date
- Jun 2013
- Age
- 40
- Posts
- 4,044
- Rep Power
- 0
USDJPY Day | Potential bearish reversal?
The USD/JPY chart displays a bullish trend, with potential for a bearish reaction off the 1st resistance at 149.13, dropping to the 1st support at 148.47. The 1st resistance aligns with the 161.80% Fibonacci projection, while the 2nd resistance is at 150.19. The 1st support coincides with the 38.20% Fibonacci retracement, and the 2nd support at 147.95 aligns with the 61.80% retracement.
Analysis are provided by InstaForex
Read More https://ifxpr.com/3tbh5OS
-
29-09-23, 07:24 #2009
Veteran Member
Just starting here
- Join Date
- Jun 2013
- Age
- 40
- Posts
- 4,044
- Rep Power
- 0
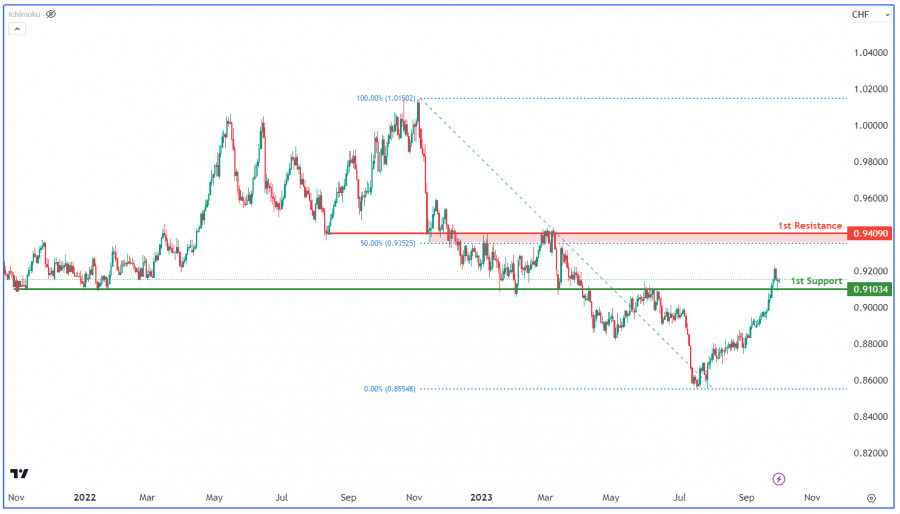
USDCHF H4 | Falling to support level?
The USD/CHF chart currently has bearish momentum, aiming for the 1st support at 0.9104, supported by the 38.20% Fibonacci Retracement. The 2nd support at 0.8987, coinciding with the 78.60% Fibonacci Retracement, provides additional price support. On the resistance side, the 1st resistance at 0.9211 and 2nd resistance at 0.9326 may limit upward moves.
Analysis are provided by InstaForex
Read More https://ifxpr.com/45cVXFh
-
02-10-23, 08:13 #2010
Veteran Member
Just starting here
- Join Date
- Jun 2013
- Age
- 40
- Posts
- 4,044
- Rep Power
- 0
USDCAD Day | Rising toward resistance level?
The USD/CAD chart shows bullish momentum with a potential move towards the first resistance. There's an important first support at 1.3372, serving as an overlap support. On the resistance side, the first resistance at 1.3673 is also an overlap resistance, and the second resistance at 1.3876 is a swing high resistance.
Analysis are provided by InstaForex.
Read More
-
03-10-23, 08:28 #2011
Veteran Member
Just starting here
- Join Date
- Jun 2013
- Age
- 40
- Posts
- 4,044
- Rep Power
- 0
GBPUSD H4 | Bouncing off support?
The GBP/USD chart is currently bearish, primarily due to its position below the bearish Ichimoku cloud. There's a potential scenario of a bullish bounce off the 1st support at 1.2067, supported by the 127.20% Fibonacci Extension, and the 2nd support at 1.2011, a swing low support with the 161.80% Fibonacci Extension.
On the resistance side, the 1st resistance at 1.2124 is an overlap resistance that may impede bullish movements. Additionally, the 2nd resistance at 1.2265 is also categorized as an overlap resistance.
Analysis are provided by InstaForex
Read More https://ifxpr.com/46vM4Dy
-
04-10-23, 08:26 #2012
Veteran Member
Just starting here
- Join Date
- Jun 2013
- Age
- 40
- Posts
- 4,044
- Rep Power
- 0
GBPUSD H4 | Bullish Divergence?
The GBP/USD chart shows bullish momentum, with the possibility of a bullish bounce from the first support at 1.2067, backed by the 127.20% Fibonacci Extension, indicating a reversal point. The second support at 1.2011, aligning with the 161.80% Fibonacci Extension, adds to its importance as a potential support level.
On the resistance side, the first resistance at 1.2124 is noted as an overlap resistance, potentially hindering bullish movements. The second resistance at 1.2273 is labeled as a swing high resistance
Analysis are provided by InstaForex
Read More https://ifxpr.com/48G7MGG
-
05-10-23, 07:42 #2013
Veteran Member
Just starting here
- Join Date
- Jun 2013
- Age
- 40
- Posts
- 4,044
- Rep Power
- 0
USDJPY H4 | Bearish Continueation Expected?
The USD/JPY chart currently exhibits bearish momentum due to its position below the Ichimoku cloud. There's a potential bearish scenario with the 1st support at 148.44, a pullback support, and the 2nd support at 147.26, an overlap support. On the resistance side, the 1st resistance at 149.98, a swing high resistance, may limit upward movements.
Analysis are provided InstaForex
Read More https://ifxpr.com/3MbAoyj
-
06-10-23, 08:09 #2014
Veteran Member
Just starting here
- Join Date
- Jun 2013
- Age
- 40
- Posts
- 4,044
- Rep Power
- 0
USDCAD H4 I Potential bullish reversal?
USD/CAD chart shows bearish momentum, potential drop to 1st support (1.3693, overlap support, 23.60% Fibonacci retracement) or 2nd support (1.3634, overlap support, 38.20% Fibonacci retracement). 1st resistance (1.3806) and 2nd resistance (1.3854) act as pullback resistances.
Analysis are provided by InstaForex
Read More https://ifxpr.com/3rvlhbS
-
09-10-23, 07:50 #2015
Veteran Member
Just starting here
- Join Date
- Jun 2013
- Age
- 40
- Posts
- 4,044
- Rep Power
- 0
Forecast for EUR/USD on October 9, 2023
EUR/USD
Friday's US labor data for September exceeded expectations. In the non-farm sector, 336,000 new jobs were created compared to a forecast of 170,000, and the August figure was raised by 40,000. Unemployment remained at the previous 3.8%, and a broader measure of unemployment dropped to 7.0% from 7.1% in August. The initial market reaction was quite natural, with the dollar rising and the euro losing 80 pips. However, the dollar was sold off across a wide range of markets, including stock markets and commodities. As a result, the dollar index closed the day down by 0.26%, the S&P 500 rose 1.18%, and oil increased by 0.61% (WTI).
The market's counteraction to strong data is certainly a compelling argument in favor of further (although not very prolonged) euro growth. From a technical standpoint, we saw a rebound from the point of intersection of the price channel line and support level of 1.0483, afterwards the quote exceeded the Fibonacci retracement level at 1.0578. The Marlin oscillator has moved into bullish territory. Now, after breaking through the nearest resistance level at 1.0613, we are waiting for the price to reach the target level of 1.0687 and maybe even 1.0777.
On the 4-hour chart, the price has settled above 1.0578. The morning gap that occurred due to the Hamas attack on Israel will soon be closed. The price is growing above the indicator lines. The Marlin oscillator has firmly strengthened in the bullish territory. We expect the euro to rise further.
Analysis are provided by InstaForex
Read More https://ifxpr.com/3ZO3f15
-
10-10-23, 08:12 #2016
Veteran Member
Just starting here
- Join Date
- Jun 2013
- Age
- 40
- Posts
- 4,044
- Rep Power
- 0
Forecast for GBP/USD on October 10, 2023
GBP/USD
Yesterday, the British pound successfully closed the gap from the start of the weekly session and continued to rise. Now the price is trying to break above Friday's high, with the nearest target at 1.2307.
Since the signal line of the Marlin oscillator only entered the positive territory recently, the momentum should be enough to reach the nearest line of the price channel around the target level of 1.2444. By breaching the resistance level, the price could reach the 1.2547 target.
On the 4-hour chart, the price is in an uptrend according to all indicators. The pound is rising above the balance and MACD lines, and these indicator lines have turned upwards. The Marlin oscillator is rising within the uptrend territory and is far from overbought. Keep an eye on the price's behavior at the target resistance level of 1.2307.
Analysis are provided by InstaForex
Read More https://ifxpr.com/3tirVT6
-
11-10-23, 10:45 #2017
Veteran Member
Just starting here
- Join Date
- Jun 2013
- Age
- 40
- Posts
- 4,044
- Rep Power
- 0
NZDUSD H4 I Bearish momentum
The NZD/USD chart currently exhibits an overall bearish momentum with a potential scenario for price to make a bearish continuation towards the 1st support level.
The 1st resistance level at 0.6050 is identified as an overlap resistance. Additionally, the 2nd resistance level at 0.6095 is marked as a pullback resistance that aligns with the 127.20% Fibonacci extension level.
To the downside, the 1st support level at 0.5989 is identified as an overlap support that aligns with the 50.00% Fibonacci retracement level. Further below, the 2nd support level at 0.5934 is noted as a pullback support.
Analysis are provided by InstaForex
Read More https://ifxpr.com/3QbBOuT
-
12-10-23, 09:29 #2018
Veteran Member
Just starting here
- Join Date
- Jun 2013
- Age
- 40
- Posts
- 4,044
- Rep Power
- 0
GBPUSD H4 I Bullish Momentum?
GBP/USD bears momentum, possibly falling to 1st support at 1.2259 (overlap support) or 2nd support at 1.2176 (overlap support). On the upside, 1st resistance at 1.2337 (swing high, 127.20% Fibonacci Extension) and 2nd resistance at 1.2418 (swing high, 161.80% Fibonacci Extension) may hinder upward movement.
Analysis are provided by InstaForex
Read More https://ifxpr.com/3FfrQlQ
-
13-10-23, 08:12 #2019
Veteran Member
Just starting here
- Join Date
- Jun 2013
- Age
- 40
- Posts
- 4,044
- Rep Power
- 0
GBPUSD H4 I Reacting off resistance level?
GBP/USD is exhibiting strong bullish momentum, with the potential to move higher towards the 1st resistance at 1.2259, a historically significant level where price often faces resistance. Conversely, on the support side, the 1st support at 1.2173, identified as a multi-swing low support, and the 2nd support at 1.2118, aligned with the 78.60% Fibonacci Retracement, hold importance as potential areas for buying interest. In summary, the current trend in GBP/USD leans towards a bullish outlook, and traders will closely monitor these support and resistance levels for potential shifts in market sentiment or reversals.
Analysis are provided by InstaForex
Read More https://ifxpr.com/3PWBf6K
-
17-10-23, 07:37 #2020
Veteran Member
Just starting here
- Join Date
- Jun 2013
- Age
- 40
- Posts
- 4,044
- Rep Power
- 0
USDCHF H4 I Potentail bullish reversal?
The USD/CHF chart currently displays bullish momentum, suggesting a possible bounce from the first support towards the initial resistance. The first support at 0.8998 aligns with a prior swing low and the second support at 0.8934 coincides with the 161.80% Fibonacci Retracement, providing strong support potential. On the resistance side, the first resistance at 0.9085 represents a multi-swing high resistance, followed by the second resistance at 0.9116, which is an overlap resistance. Additionally, there's an intermediate resistance at 0.9039, also acting as an overlap resistance.
Analysis are provided by InstaForex
Read More https://ifxpr.com/3LZoGGz

 Reply With Quote
Similar Threads
-
Forex News from InstaForex
By InstaForex Gertrude in forum Advertisement PlaceReplies: 2103Last Post: 16-02-24, 10:27 -
Forex Technical & Market Analysis FXCC
By alayoua in forum Advertisement PlaceReplies: 4Last Post: 07-07-16, 00:25 -
Weekly technical analysis for 3 - 7.12, 2012
By bellalca in forum Affiliate program networksReplies: 0Last Post: 04-12-12, 07:09


Bookmarks